


Thanksgiving Data - Macy’s Parade
Posted on Dec 03, 2015 by Admin
With the Thanksgiving holiday last week, we decided to take a quick look into SimplyMap to see what pertinent variables are available for analysis.
First, open the Variables panel and click on Search. Type in “Thanksgiving” in the available box.
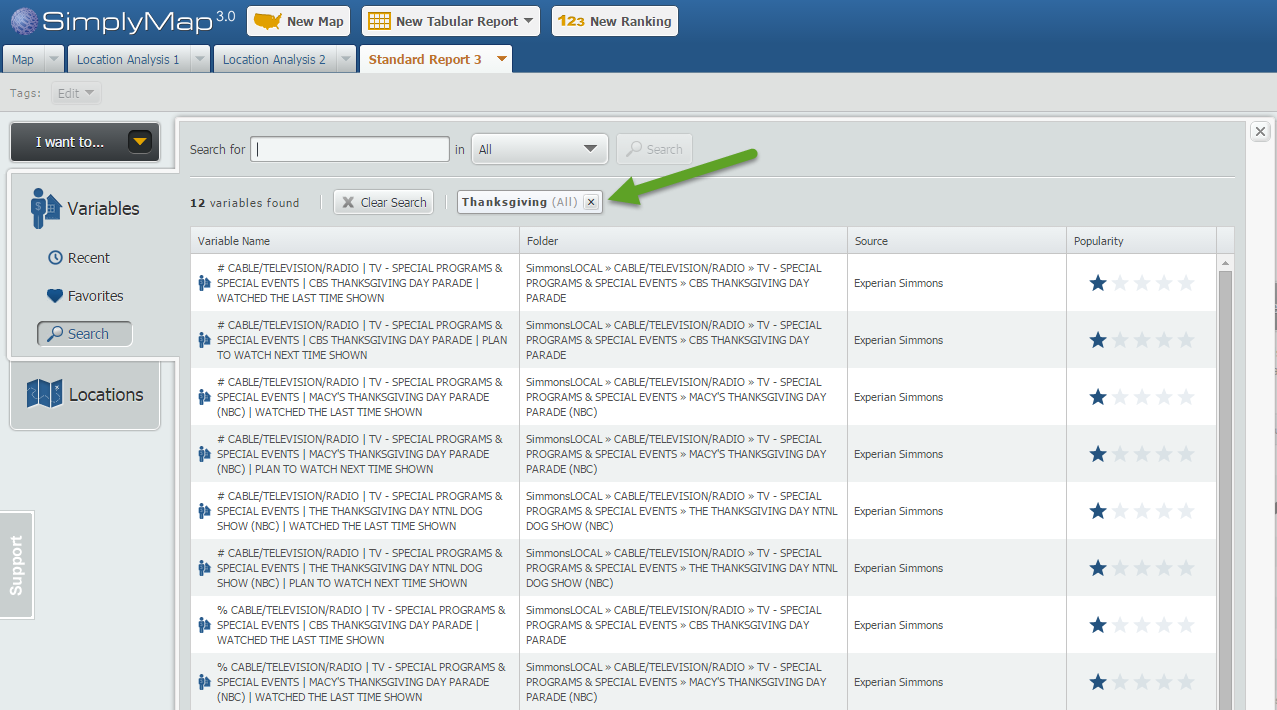
The results display a total of 12 variables related to the keyword ‘Thanksgiving’.For fun, we also searched the keyword: turkey. Care to take a guess how many turkey related variables are in SimplyMap?
If you guessed 122, you’re right! There is a grand total of 122 variables related to the word ‘turkey’, ranging from:
% Households Traveling - Foreign Travel (Including Alaska & Hawaii): Countries or destinations visited: Turkey, 2014
to variables such as:
% Households Using - Chicken & Turkey Fresh Or Frozen: Used in last 6 months, 2014
Interesting! Now returning to our original Thanksgiving search we decided to find out the estimated expected number of viewers for this year’s Macy’s Thanksgiving Parade.
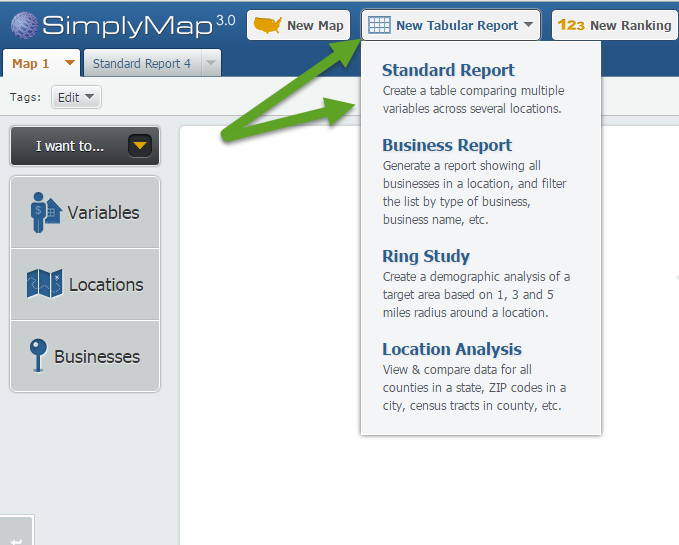
Click on New Tabular Report > Standard Report
The Thanksgiving variables are located in the SimmonsLOCAL folder. The SimmonsLOCAL data set is a premium add on module available for trial or purchase and includes over 60,000 data variables.
Navigate through this path: SimmonsLOCAL » CABLE/TELEVISION/RADIO » TV - SPECIAL PROGRAMS & SPECIAL EVENTS » MACY'S THANKSGIVING DAY PARADE (NBC)
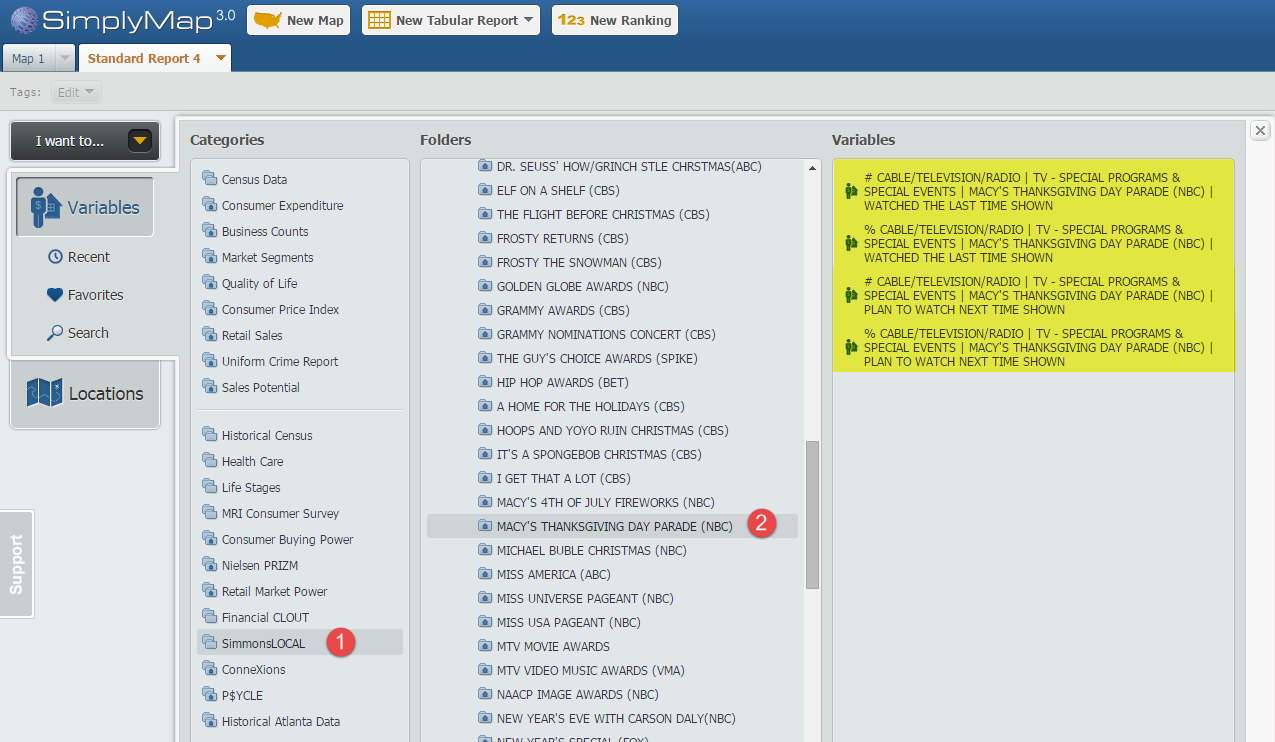
Choose the four variables within the folder, and close out the Variables panel to generate your report for the United States.
Results:
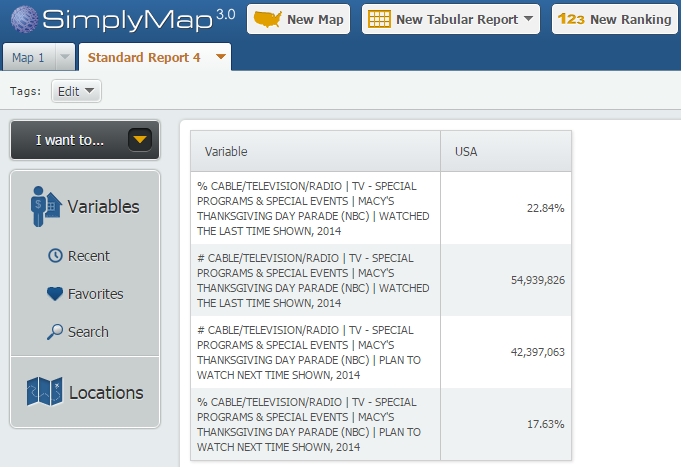
It’s estimated that over 54,000,000 people in the US responded that they had seen the Macy’s Thanksgiving Parade in 2014, with over 42,000,000 responding that they plan to watch the next event!
We hope you enjoyed this week’s report. Stay tuned for more SimplyMap tips and reports.
More from SimplyAnalytics
Posted on Jan 18, 2009 by Admin
Michigan State University is offering their users a basic introduction to using SimplyMap. The 1.5 hour session will cover the basics of how to use SimplyMap to create maps and reports u...
Posted on Nov 28, 2012 by Admin
Come visit the SimplyMap team at the ALA Midwinter Meeting, January 25 - 28, 2013 in Seattle, WA. We will be in Booth 1307, and as always we look forward to meeting with customers new and...
Posted on Sep 18, 2015 by Admin
With tens of thousands of variables available in SimplyMap, it’s common for users to wonder whether or not a particular variable they have in mind is available in SimplyMap. This is where...
Posted on May 15, 2015 by Admin
In this week’s SimplyMap report, we want to share with you the many options available when exporting maps in SimplyMap. In SimplyMap, when a user selects Export Map Image from the Actions...
Posted on Sep 05, 2019 by Admin
We are pleased to be exhibiting again at the Charleston Library Conference, on Tuesday November 5th, 2019. The Vendor Showcase will be held in the Gaillard Center Grand Ballroom (95 Calho...
Posted on Nov 04, 2013 by Admin
SimplyMap 3.0 is here, and uses the latest technology to provide better performance, improved reliability, and powerful new features. There are many improvements designed to make it easie...
Posted on May 17, 2012 by Admin
We will be exhibiting at the American Library Association (ALA) Conference in Anaheim Friday June 22nd - Monday June 25th. Visit us at Booth 421 to learn more about SimplyMap and enter ou...
Posted on Oct 08, 2008 by Admin
Geographic Research, Inc. (GRI) is pleased to sponsor the fourth annual American Collegiate Retailing Association’s Undergraduate Student Retail Analysis Competition. This is the second ...
Posted on Jun 09, 2016 by Admin
In this week’s blog, we’ll be featuring our newest data offering, PRIZM® Premier. If your institution currently subscribes to PRIZM data, this new module is available at no additional cos...
Posted on Apr 27, 2015 by Admin
In this week’s write up we want to share some quick tips and tricks that you might not yet know about in SimplyMap. TIP #1 Did you know that you can share your work? SimplyMap allows you ...