


The Location Query Report
Posted on Mar 13, 2023 by Admin
Hello readers! Today, we’re excited to officially introduce the Location Query Report in SimplyAnalytics. The Location Query Report is a powerful feature in SimplyAnalytics that allows users to quickly and easily identify target locations. This report is especially useful for businesses, researchers, and marketers who are looking to find some locations based on their desired conditions. Think of this report as a reimagining of the data filters, where we’ve put that functionality into a report and made it easier to understand what you are viewing. Let’s take a look at an example.
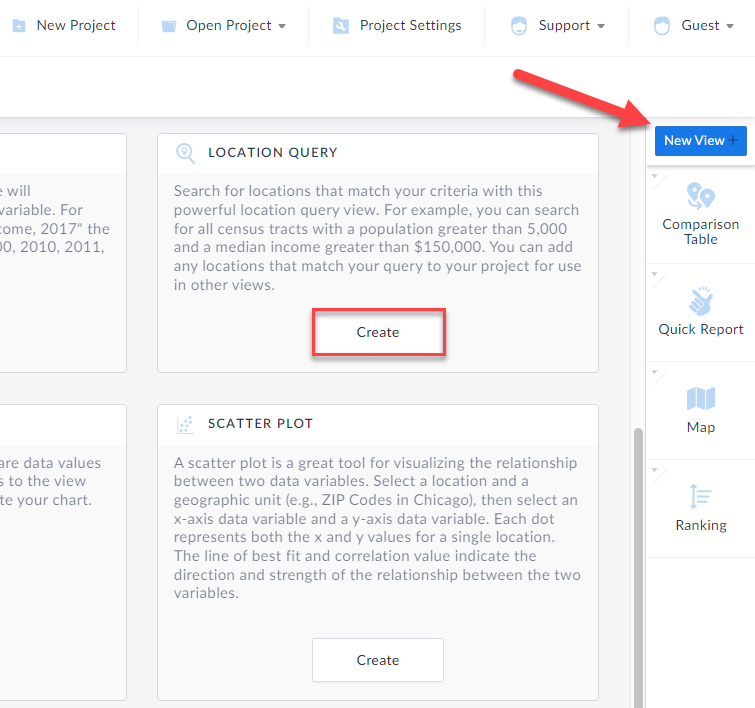
How to Create this Report:In your project, click on New View > “Create” Under the Location Query report
The Location Query report appears. Some tips in the image below of the layout:
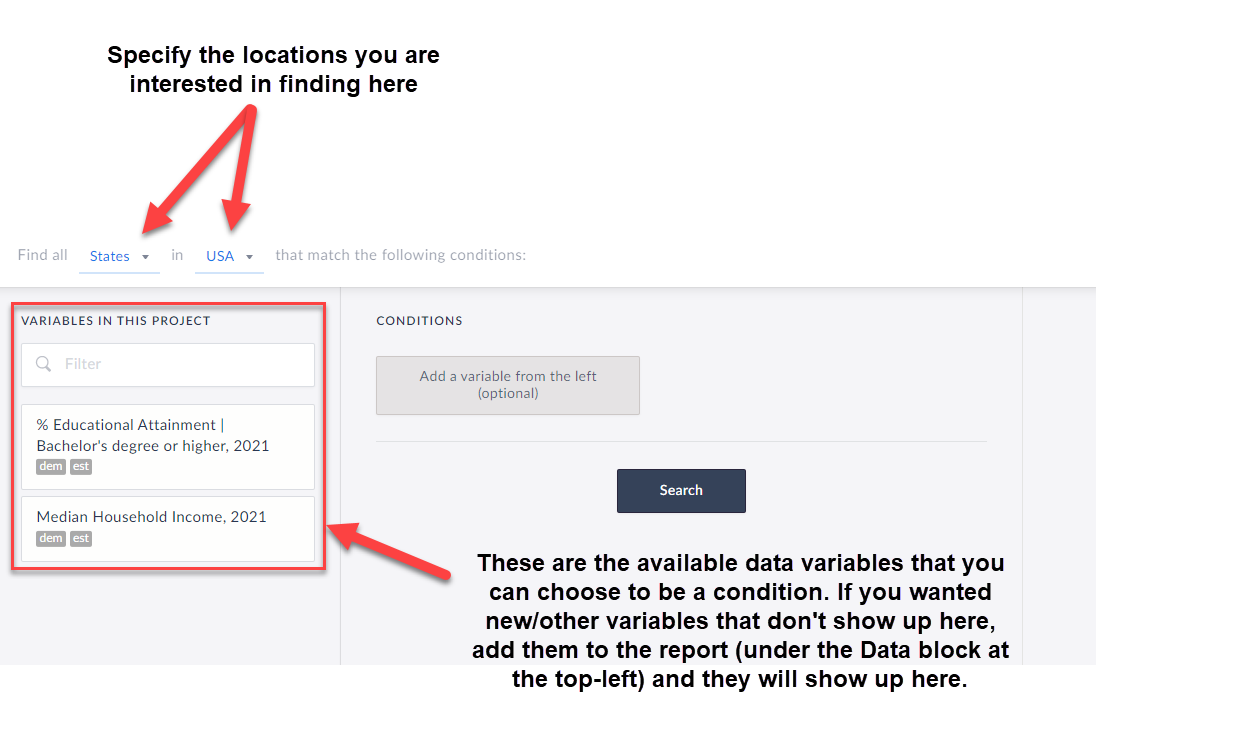
To begin the query, first choose from the dropdown at the top that reads: Find all X in Y that match the following conditions. This is where to choose which locations you are looking for. For example, find all ZIP Codes in Colorado, or all Census Tracts in Miami-Dade County, etc.
Next, add in variables by clicking on them and specify the conditions you are looking for. TIP: Any data variable in SimplyAnalytics can be a condition, and you are welcome to have dozens of conditions, so feel free to be as creative or as specific as you want!
Click Search, and voila! The far-right side of the workspace will display which locations meet your criteria. Check out the report we created below:
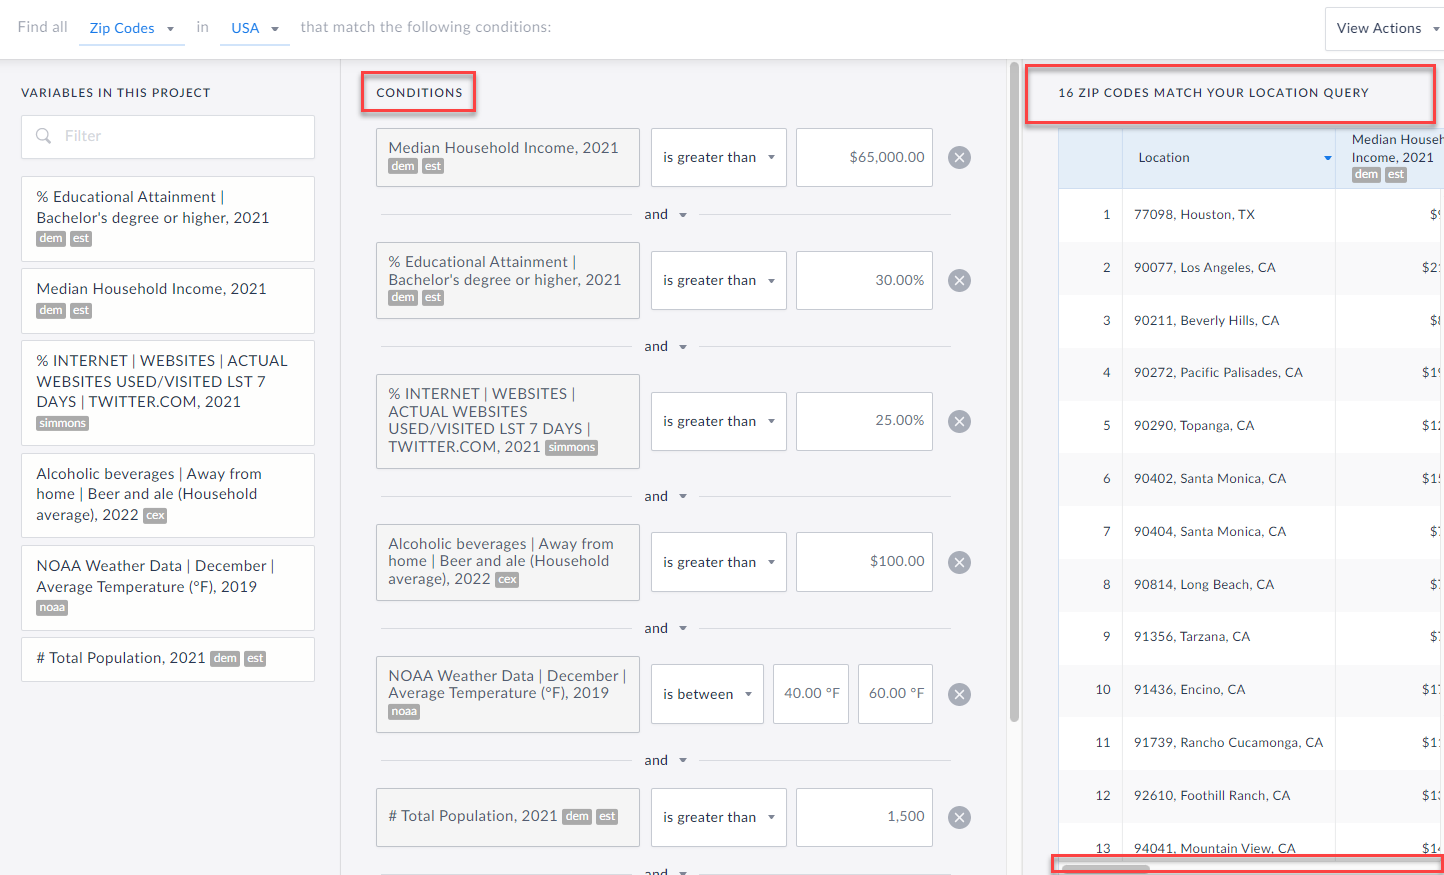 So, in case you were wondering - there are 16 ZIP Codes in the USA that:
Have a Median HH Income greater than $65,000
AND
The % of Adults 25+ with a Bachelor’s degree or higher is greater than 30%
AND
The % of adults who have been on Twitter in the past week is greater than 25%
AND
The Average HH spends more than $100 on Beer and Ale away from Home
AND
The Average Temperature in December is between 40 and 60 degrees
AND
The Zip Codes have a population of more than 1,500
This is sort of a silly example, but it does highlight what you are capable of doing with this report in SimplyAnalytics. Let us know any interesting queries you come up with!
More from SimplyAnalytics
Posted on Feb 17, 2015 by Admin
Our recent trip to Chicago exhibiting at the ALA Midwinter Meeting inspired this week’s SimplyMap blog post. Today, we’re going to demonstrate how to use business points in SimplyMap to a...
Posted on Dec 03, 2015 by Admin
With the Thanksgiving holiday last week, we decided to take a quick look into SimplyMap to see what pertinent variables are available for analysis. First, open the Variables panel and cli...
Posted on Jan 23, 2024 by Admin
We are excited to again make the trip to Los Angeles for SCELCapalooza 2024 hosted at Loyola Marymount University! Please drop by our table on Wednesday, Feb. 28th to learn more about Sim...
Posted on Jul 30, 2015 by Admin
One great feature within SimplyMap is the ability to track the same variable across multiple years. In this report, we will track the percentage of households in the US ordering items fro...
Posted on Nov 19, 2019 by Admin
Hello readers! Today we are bringing you a new blog entry inspired by a recent Help Desk question. If you ever have any questions about SimplyAnalytics, please do not hesitate to reach ou...
Posted on Jan 16, 2026 by Admin
We are excited to be exhibiting at the Public Library Association (PLA) 2026 Conference in Minneapolis this April 1-3!
Posted on May 08, 2018 by Admin
We will be exhibiting at the SLA conference in Baltimore, MD this June. Stop by booth #912 and say hello - we look forward to demonstrating SimplyAnalytics, answering your questions, and ...
Posted on May 02, 2016 by Admin
Inspired by a recent support desk question, this week’s SimplyMap report will demonstrate how a user would run a business search that consists of multiple names. In short, the user was at...
Posted on Nov 22, 2016 by Admin
We will be exhibiting at ALA Midwinter in Atlanta, Georgia in January. You can find the GRI team at Booth 1155, where we will be catching up with customers old and new, and sharing some e...
Posted on Mar 30, 2016 by Admin
In previous blog entries we highlighted the usefulness of viewing multiple years of data for the same variable. In short, analyzing the same variable across multiple years allows users to...