


The Landline Telephone’s Descent
Posted on Mar 30, 2016 by Admin
In previous blog entries we highlighted the usefulness of viewing multiple years of data for the same variable. In short, analyzing the same variable across multiple years allows users to identify trends. For example, in one of the previous blogs we showcased the explosion of tablet ownership over recent years (quadrupling!).For this week’s blog, we’ll see if the data matches our own observations on the rapid decline of landline phones in households. Let’s get started!
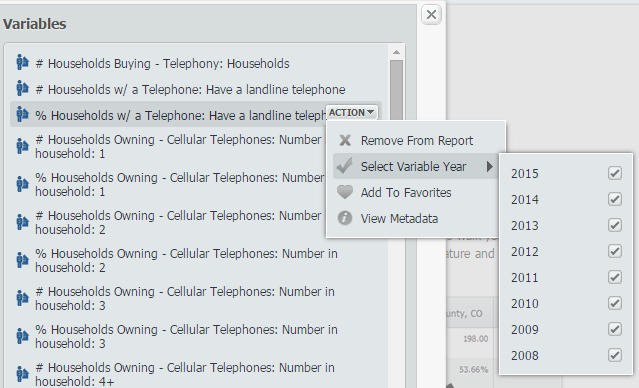
First, open a Standard Report and navigate through this path: MRI Consumer Survey » Telephone to find the variable, % Households w/ a Telephone: Have a landline telephone, 2015.
Hover over the variable and select the Select Variable Year option from the Action Dropdown menu. You will see the years 2008-2015 on your screen. Select each year as shown below:
Close out the variables panel to generate your report for the United States. Here are the results:
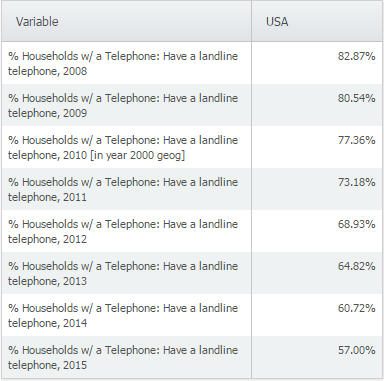
The percentage of households with a landline telephone has dropped significantly, from 82.87% in 2008 to 57% in 2015. We suspect this decrease is due in part to the rise in cell phones among other things, but we’ll leave that data to another blog.
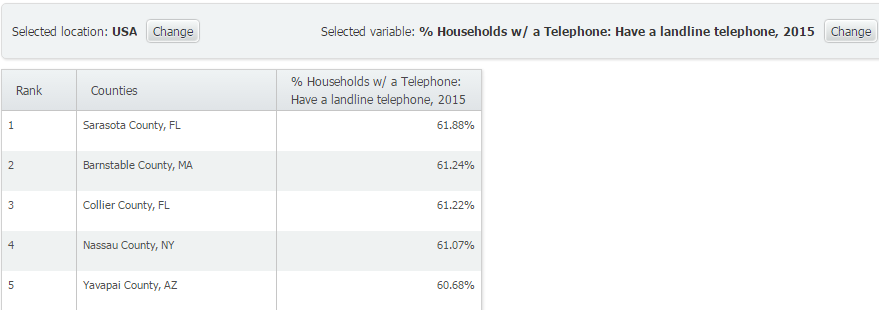
Out of curiosity, we ran a Ranking Report to determine the top 5 counties in America with the highest % of households having a landline telephone:
Note: We applied a population filter of > 200,000.
We hope you enjoyed this week’s SimplyMap report - stay tuned for more!
More from SimplyAnalytics
Posted on Oct 27, 2017 by Admin
Welcome to our first ever SimplyAnalytics blog! Every Friday we’ll post a write up on a specific feature or highlight some interesting data in SimplyAnalytics. The goal of these posts is ...
Posted on May 08, 2018 by Admin
We will be exhibiting at the SLA conference in Baltimore, MD this June. Stop by booth #912 and say hello - we look forward to demonstrating SimplyAnalytics, answering your questions, and ...
Posted on Feb 24, 2019 by Admin
We will be exhibiting at SCELC* Vendor Day on March 14th. Visit us at table 510 and attend one of our two sessions demonstrating SimplyAnalytics. The presentations will highlight newly av...
Posted on Aug 15, 2013 by Admin
Anyone who has traveled to Seattle hoping for a sunny day could fairly estimate that it is one of the rainiest states with the highest level of precipitation each year. SimmonsLOCAL varia...
Posted on Aug 02, 2016 by Admin
Did you know that you can use SimplyMap to identify which make and model of vehicle is most prevalent within any location in the United States? In this week’s SimplyMap report, we’ll take...
Posted on Mar 13, 2023 by Admin
Hello readers! Today, we’re excited to officially introduce the Location Query Report in SimplyAnalytics. The Location Query Report is a powerful feature in SimplyAnalytics that allows us...
Posted on Jun 21, 2019 by Admin
Come visit the SimplyAnalytics booth (#3010) at the upcoming ALA 2019 show in Washington, D.C.! Our team will be on hand offering quick demos of SimplyAnalytics, answering questions and s...
Posted on Jul 30, 2015 by Admin
One great feature within SimplyMap is the ability to track the same variable across multiple years. In this report, we will track the percentage of households in the US ordering items fro...
Posted on Oct 07, 2013 by Admin
Do you know the quickest way to find the name of a Block Group, Census Tract or ZIP code in our upcoming release for 3.0? The i-Tool gives you the ability to click anywhere on a map to g...
Posted on Jul 09, 2015 by Admin
In this week’s SimplyMap report, we set out to find which cities have the highest percentages of people who use their bike as their mode of transportation to work in the US. Let’s get sta...