


Exploring SimplyMap Data: SimmonsLOCAL Lifestyle Statements
Posted on Jun 08, 2015 by Admin
In this week’s report we take a look at one folder found within SimplyMap’s SimmonsLOCAL data package. SimmonsLOCAL is a powerful targeting and profiling system that provides insights into consumer behavior for all of America's 210 media markets on a local level with 60,000+ data variables, including over 450 categories and 8,000 specific brands.
The folder we are looking at today is the Lifestyle Statements folder. Here you will find 26 unique lifestyle statement subcategories ranging from attitude and opinions on apparel, to diet and health statements. The picture below shows the options available.
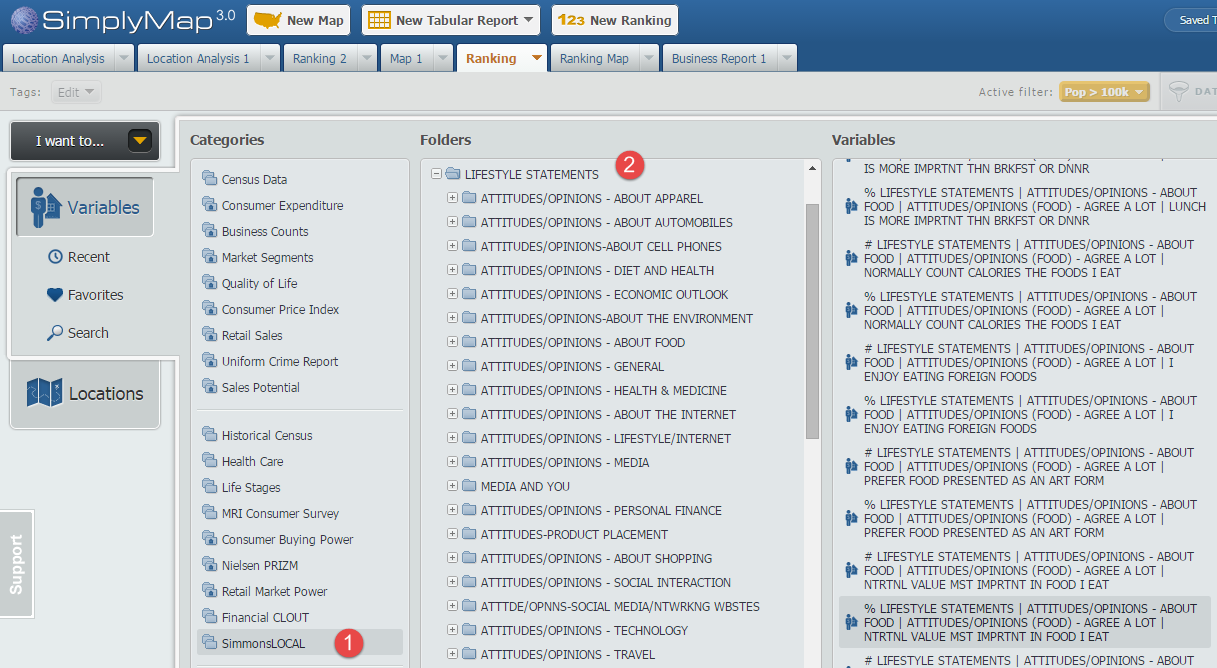
In this showcase we will create a Ranking Report using the variable statement AGREE A LOT - NUTRITIONAL VALUE MOST IMPORTANT IN FOOD I EAT. This can be found at this path:
SimmonsLOCAL » LIFESTYLE STATEMENTS » ATTITUDES/OPINIONS - ABOUT FOOD » ATTITUDES/OPINIONS (FOOD) - AGREE A LOT
First, select New Ranking found at the top of SimplyMap. Next, click on Variables and navigate through the above path to locate the variable.
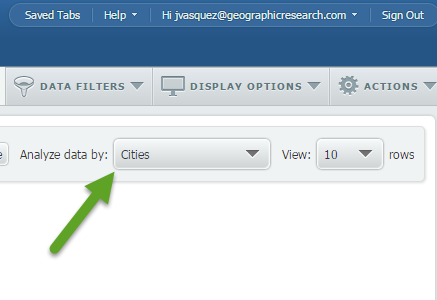
Under locations, select USA as your geography and use the Analyze Data By functionality to select Cities.
Apply a population filter (read more about using filters here) to only show cities with 100,000 or more residents, and the final result will look like this:
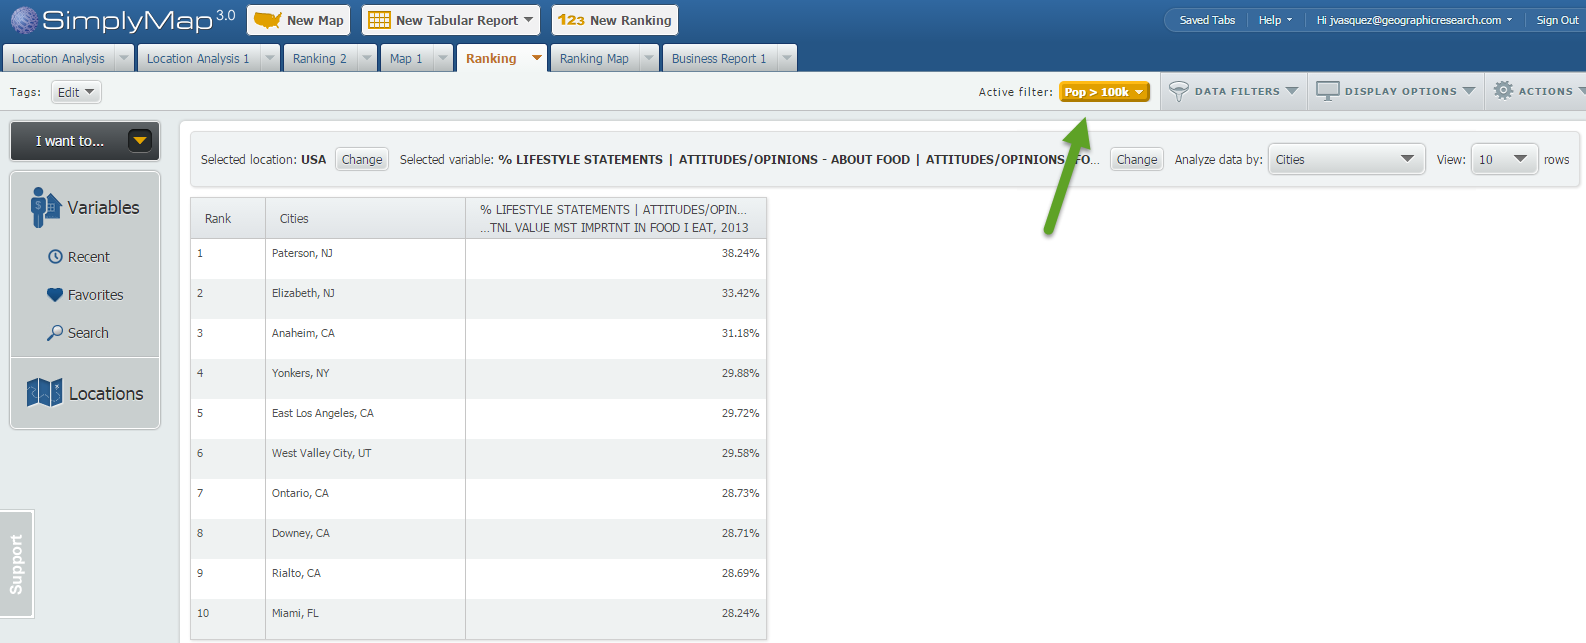
Note: you can see your applied filter located towards the top of your report by the Active Filter text.
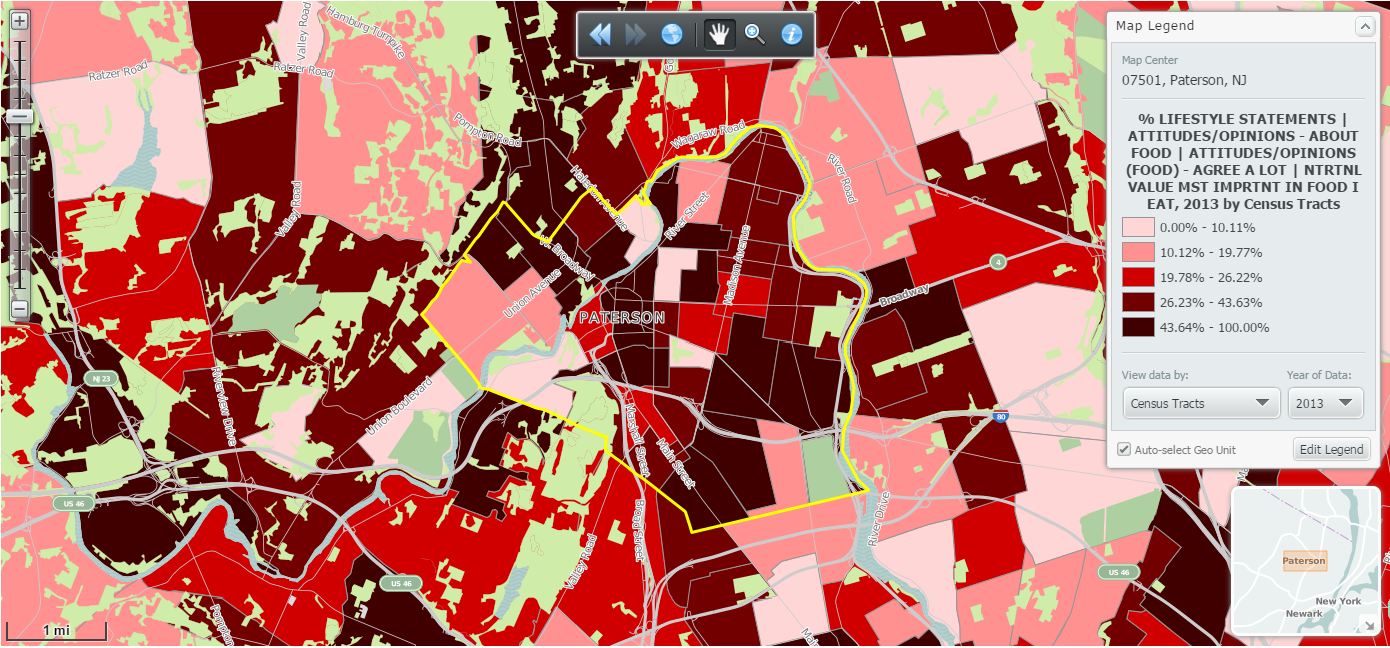
At 38.24% Paterson, NJ ranks first in the United States (cities > 100k) for folks who agree a lot with the statement: NUTRITIONAL VALUE MOST IMPORTANT IN FOOD I EAT.
To quickly map Paterson, NJ hover over the location and select Create Map:
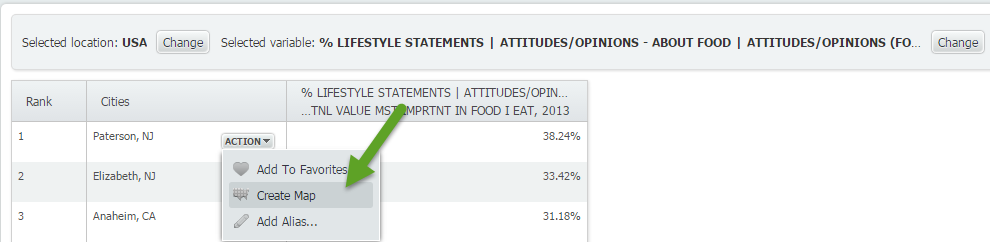
Map of Paterson, NJ:
We hope you enjoyed this look into the SimmonsLOCAL data set. With over 60,000 variables in the package, we will be posting many more variable spotlight reports.
Don’t forget to follow us on Twitter, and Like Us on Facebook to stay up to date with SimplyMap.
More from SimplyAnalytics
Posted on Aug 22, 2009 by Admin
Lynda Kellam, the Data Services & Government Information Librarian at the University of North Carolina, Greensboro has produced some new tutorial videos to help students learn how to ...
Posted on Jan 12, 2020 by Admin
Happy New Year! SimplyAnalytics will be exhibiting at the ALA Midwinter meeting, held this year at the Pennsylvania Convention Center in Philadelphia on January 24th-27th. If you attend, ...
Posted on May 02, 2016 by Admin
Inspired by a recent support desk question, this week’s SimplyMap report will demonstrate how a user would run a business search that consists of multiple names. In short, the user was at...
Posted on Nov 29, 2009 by Admin
The ALA 2010 Midwinter Meeting will be held on January 15-19, 2010 at the Boston Convention and Exhibition Center. (Note that this is not the Hynes Convention Center). Geographic Research...
Posted on May 25, 2010 by Admin
The American Library Association 2010 Annual Conference is coming and the GRI team is gearing up for another great event this summer. We will be in Washington, D.C. again this year, June ...
Posted on Oct 27, 2017 by Admin
Welcome to our first ever SimplyAnalytics blog! Every Friday we’ll post a write up on a specific feature or highlight some interesting data in SimplyAnalytics. The goal of these posts is ...
Posted on Mar 30, 2016 by Admin
In previous blog entries we highlighted the usefulness of viewing multiple years of data for the same variable. In short, analyzing the same variable across multiple years allows users to...
Posted on Jul 30, 2015 by Admin
One great feature within SimplyMap is the ability to track the same variable across multiple years. In this report, we will track the percentage of households in the US ordering items fro...
Posted on Feb 05, 2015 by Admin
Our Winter Sweepstakes has begun! Enter to win an iPad Mini 3 or Kindle Fire. How to Enter: Follow @SimplyMap on Twitter Like our SimplyMap Facebook Page for a 2nd Chance to Win If you ...
Posted on May 19, 2016 by Admin
Drop by booth #215 at the SLA 2016 conference to chat with us and get the latest info on SimplyMap. We look forward to seeing our customers, friends, and all others interested in learning...