


Exploring SimplyMap Data: America’s Work from Home Employees
Posted on Feb 13, 2015 by Admin
In this week’s report exploring SimplyMap data, we want to find out where America’s remote workers reside. To find this, we can tap into the Census data in SimplyMap. The specific variable is titled: % Employment, Work at Home, 2014.
To get started ranking geographies, first select New Ranking at the top of the SimplyMap screen. Next, locate the variable by following this path: Census Data » In 2010 Geographies » People and Households » Employment » Travel to Work » Mode.
Lastly, to view this data by state select Locations, and set it to USA.
From the Analyze Data By dropdown, select “States” to rank the USA by all states. The results are shown below:
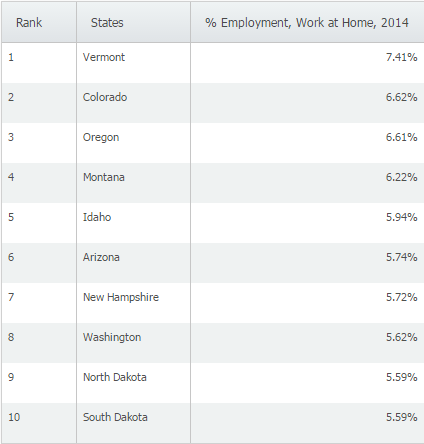
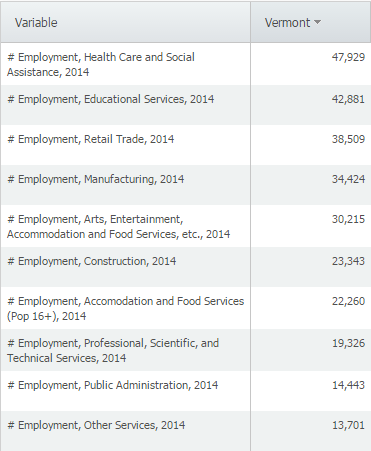
At 7.41%, Vermont ranks first in the US for remote workers. For reference, the national percentage is 4.38. Does anyone have insight as to why Vermont ranks first? A list of the most common employment industries in Vermont is below:
Lastly, we can look at the data by a different geography - change the Analyze Data By dropdown to display Cities. We can also apply a population filter to only show cities with a population greater than 100,000. Here are the results:
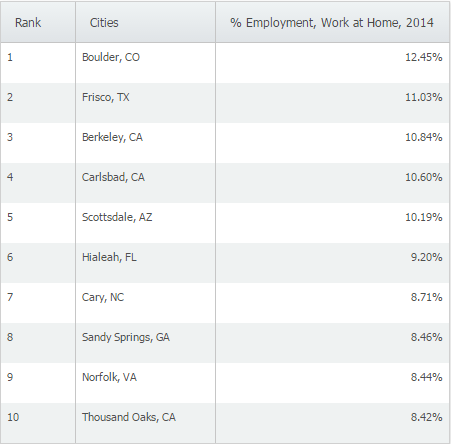
Boulder, CO ranks first in the United States for Work at Home employees. We think this could be attributed to the number of software and tech firms that have opened up or moved to that city in recent years.
We hope you found this SimplyMap report interesting. Stay tuned for more SimplyMap tips and interesting data reports.
Have you already entered for your chance to win an iPad or Kindle Fire? We will be holding the drawing on April 17, 2015. To enter, simply follow us on Twitter and Like Us on Facebook to get your name in consideration.
More from SimplyAnalytics
Posted on Sep 15, 2025 by Admin
SimplyAnalytics will be attending the upcoming NCLA Conference in Winston-Salem October 14-17!
Posted on Jun 09, 2021 by Admin
Hello readers! SimplyAnalytics will be exhibiting at the Virtual ALA Annual Conference this year on June 23-26. Be sure to drop by our booth, and click the banner image to video chat with...
Posted on Mar 21, 2011 by Admin
Men's Health magazine decided to crown one town America's Most Socially Networked City, and has generated quite a buzz in the process. Their survey examined the number of Facebook and Li...
Posted on Apr 07, 2020 by Admin
As COVID-19 spreads across the United States researchers need access to the latest data visualization and analytics tools. As a result, the SimplyAnalytics team just added COVID-19 data ...
Posted on Apr 30, 2024 by Admin
Congratulations to Brandyn Whitaker as the recipient of the 2024 BRASS Student Travel Award! Brandyn is a Library Services Associate in the Workforce and Economic Development department a...
Posted on Oct 12, 2010 by Admin
NC LIVE, a member-driven library service organization dedicated to providing online information services that support education, enhance statewide economic development, and increase qu...
Posted on Jan 23, 2015 by Admin
SimplyMap offers a total of 5 unique types of reports: Standard Report, Ranking Report, Business Report, Ring Study, and Location Analysis. This brief write up will define what each repor...
Posted on Dec 02, 2014 by Admin
Today we take a look at one of the more advanced features in SimplyMap - editing the map legend. Editing the map legend is a great way to not only customize how the data is distributed on...
Posted on Apr 30, 2020 by Admin
We find ourselves in the middle of an unprecedented crisis the likes of which most of us have never experienced before, and hopefully won’t have to experience again. There is the occasion...
Posted on Mar 09, 2010 by Admin
The GRI team will be exhibiting at the 2010 Public Library Association conference later this month at the Oregon Convention Center in Portland, OR. The PLA National Conference is the prem...