


SimplyMap Tip: Using Multiple Years
Posted on Jul 30, 2015 by Admin
One great feature within SimplyMap is the ability to track the same variable across multiple years. In this report, we will track the percentage of households in the US ordering items from Amazon.com, as we suspect it might show a marked increase over the span of the available years. The value in viewing the same variable over multiple years is that it helps users identify trends in the data over time.
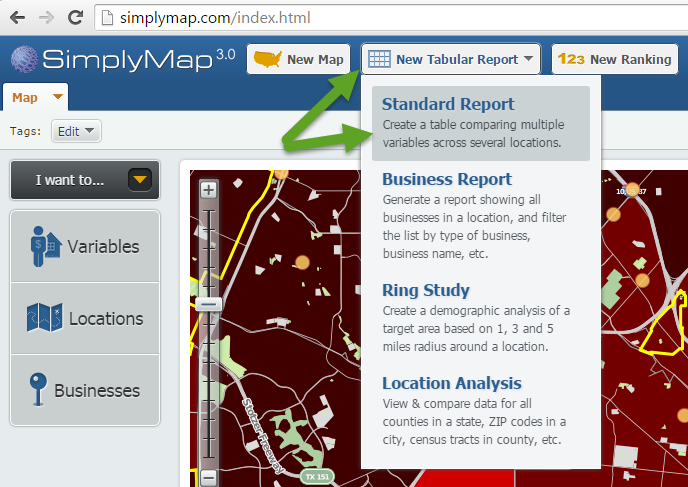
Let’s get started. First, create a Standard Report by selecting New Tabular Report > Standard Report at the top of your screen.
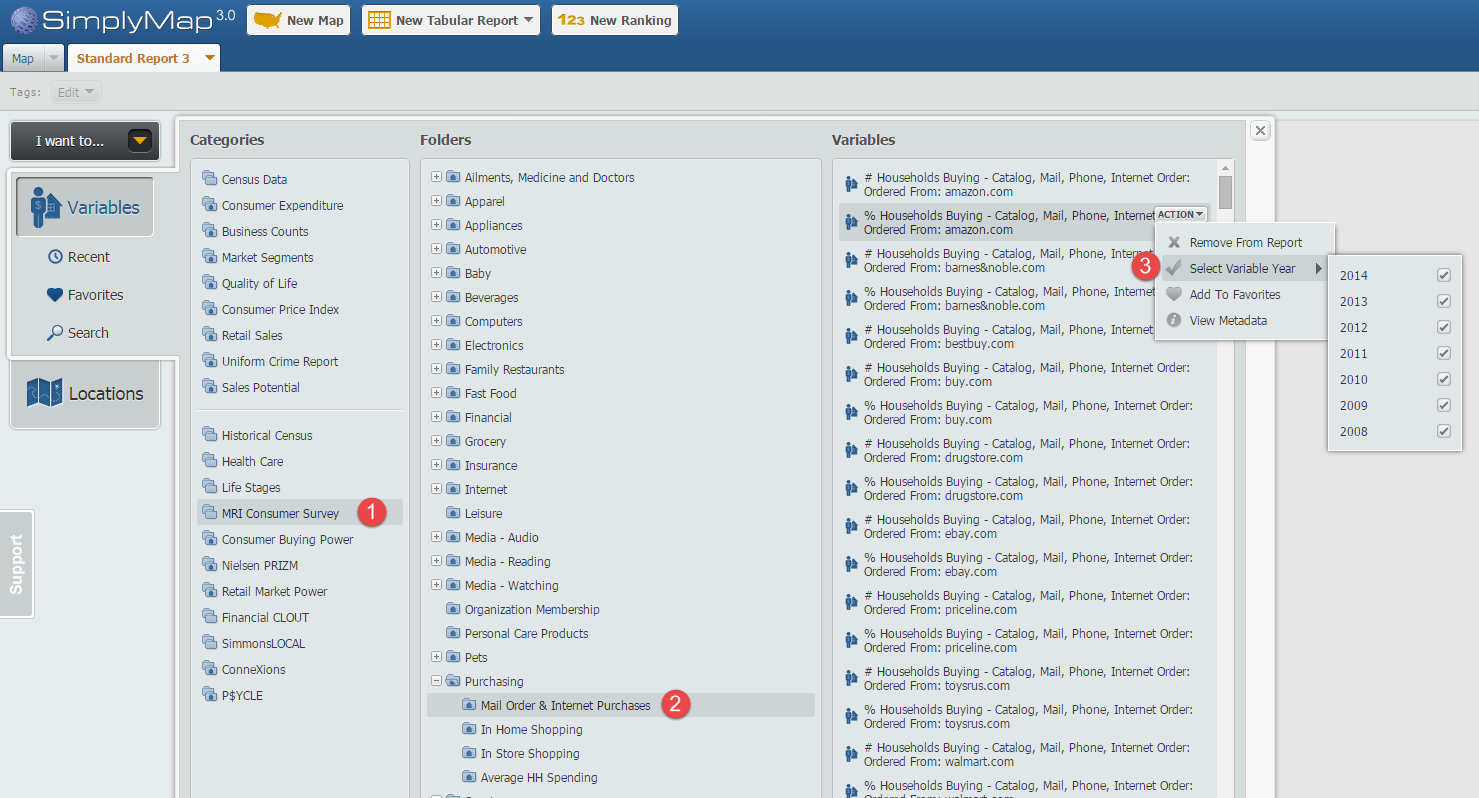
Next, navigate through this path: MRI Consumer Survey » Purchasing » Mail Order & Internet Purchases and hover over the variable, % Households Buying - Catalog, Mail, Phone, Internet Order: Ordered From: amazon.com, 2014 so the actions menu appears. From the “Select Variable Year” option check off the list of years you would like to see. In this example we will use 2008-2014. See the image below for reference:
Close out the variables panel, and your Standard Report will be created using the United States by default. Results below!
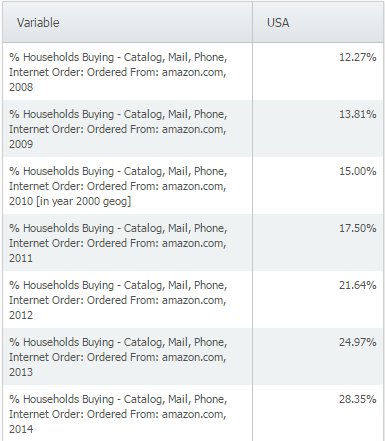
The data clearly shows a trend in Amazon.com ordering throughout years, more than doubling from 2008 to 2014 nationally. We suspected this at the onset, and the data appears to back up our initial thoughts. Feel free to add any additional geographies you’d like to see - the data is available down to the block group level.
There are over 200 variables available within the Mail Order & Internet Purchases folder in the MRI Consumer Survey data, including other websites such as:
ebay.com
buy.com
priceline.com
bestbuy.com
walmart.com
And purchases by catalog/mail order from:
QVC
L.L. Bean
Macy’s
Nordstrom
We encourage you to explore the many variables found within the MRI data package. If your school or library does not currently subscribe to the MRI data set, please write in to support@geographicresearch.com. We are always happy to provide demonstrations and trials of data packages at no cost.
What other trends have you utilized SimplyMap to identify? Let us know in the comments below!
More from SimplyAnalytics
Posted on Jan 05, 2018 by Admin
The SimplyAnalytics team is looking forward to exhibiting at the Ontario Library Association Super Conference 2018! Stop by the SimplyAnalytcs booth (115T) and take a look at our newest o...
Posted on Dec 15, 2014 by Admin
Custom Locations allow SimplyMap users to combine several locations into one larger region. For example, you can use this feature to combine three adjacent ZIP Codes to create your study ...
Posted on Mar 02, 2009 by Admin
ACRL's 14th National Conference will be held at the Washington State Trade and Convention Center in downtown Seattle, March 12-15, 2009. Every other year, ACRL offers its premier profe...
Posted on Oct 08, 2019 by Admin
Hello readers! This week’s “From the Help Desk” is short & sweet. Let’s get to it! Question: How do I analyze all of the states at once in a report? Answer: The Ranking Report allows ...
Posted on Nov 19, 2019 by Admin
Hello readers! Today we are bringing you a new blog entry inspired by a recent Help Desk question. If you ever have any questions about SimplyAnalytics, please do not hesitate to reach ou...
Posted on May 26, 2016 by Admin
In this week’s report exploring SimplyMap data, we take a look at the variables available relative to internet search engines used. The source of this data will come from the SimmonsLOCAL...
Posted on Mar 02, 2018 by Admin
In this week’s blog we’ll take a look at how to enter an address in SimplyAnalytics to find the Census Block Group or Census Tract. Let’s get started! Use Case: You want to analyze the ar...
Posted on Sep 10, 2019 by Admin
Hello readers! It’s been a minute since our last tutorial post, but you can expect to see more content on a weekly basis moving forward. “From the Help Desk” is a new feature on the blog ...
Posted on Apr 21, 2015 by Admin
In this week’s edition of exploring SimplyMap data, we spotlight the Consumer Buying Power® data package in SimplyMap. What is it? The Nielsen Consumer Buying Power® database incorporates...
Posted on Sep 15, 2016 by Admin
While creating a radius location is the fastest and easiest method for creating a custom location, there may be situations that require a more specific and targeted locale. Let’s say for ...