


From the Help Desk: How to Analyze all PRIZM Segments at Once
Posted on Dec 02, 2019 by Admin
Hi everybody! We’re back this week with another question from our Help Desk. This time featuring SimplyAnalytics Canada. Let’s get started!
Question: How can I analyze all of the PRIZM5 segments for my target area so I can identify the most common segment?
Note: For those unfamiliar with the PRIZM data, this dataset is a marketing segmentation system where households are grouped into one of 68 unique segments based on: demographics, lifestyles, consumer behaviour and settlement patterns in Canada. These segments help you understand what customers are buying, doing and thinking. This is ideal for target marketing, trade area analysis, merchandising and media planning.
Please give us an email if you would like a free trial to the PRIZM data - it is available for both SimplyAnalytics USA and SimplyAnalytics Canada.
Answer: The quickest and easiest way to analyze many similar variables at once is to utilize the Related Data Table. The Related Data Table automatically adds in any similar variables to your chosen one. In this example, we’ll add one PRIZM segment, and the report will add all of them in. This can be used with any variable or dataset - give it a try!
Here’s how:
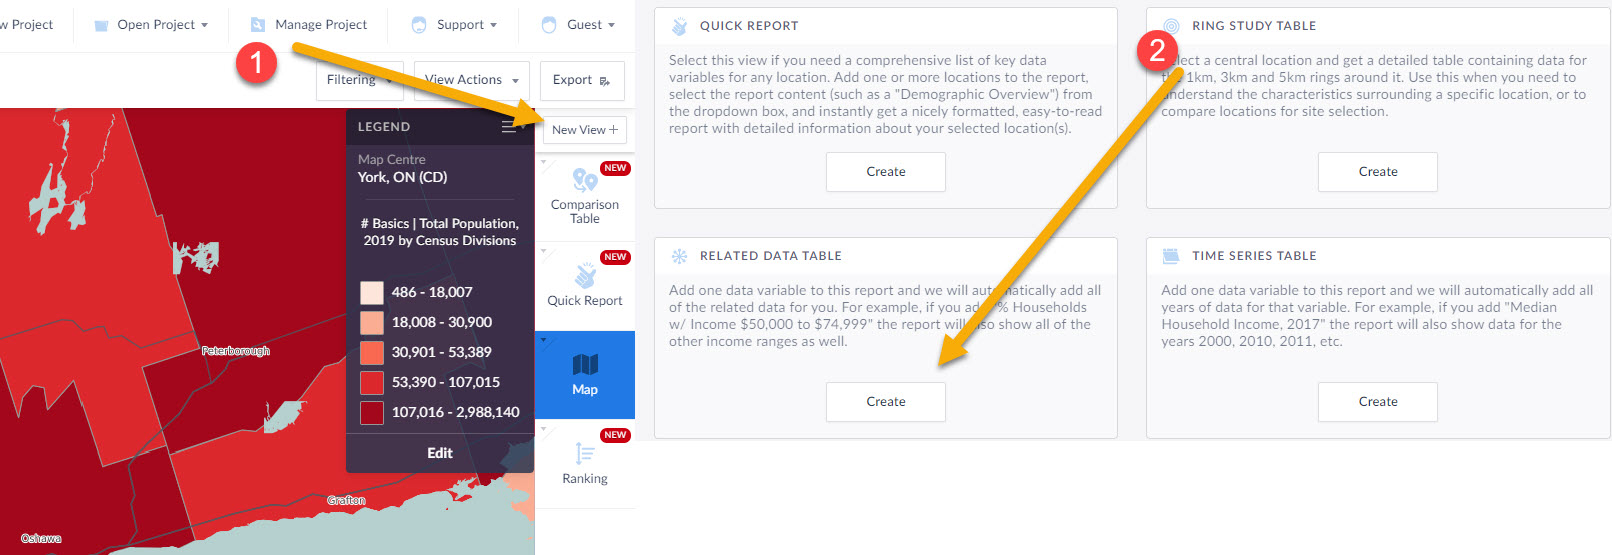
1.) Click on New View towards the top right, then create under Related Data Table
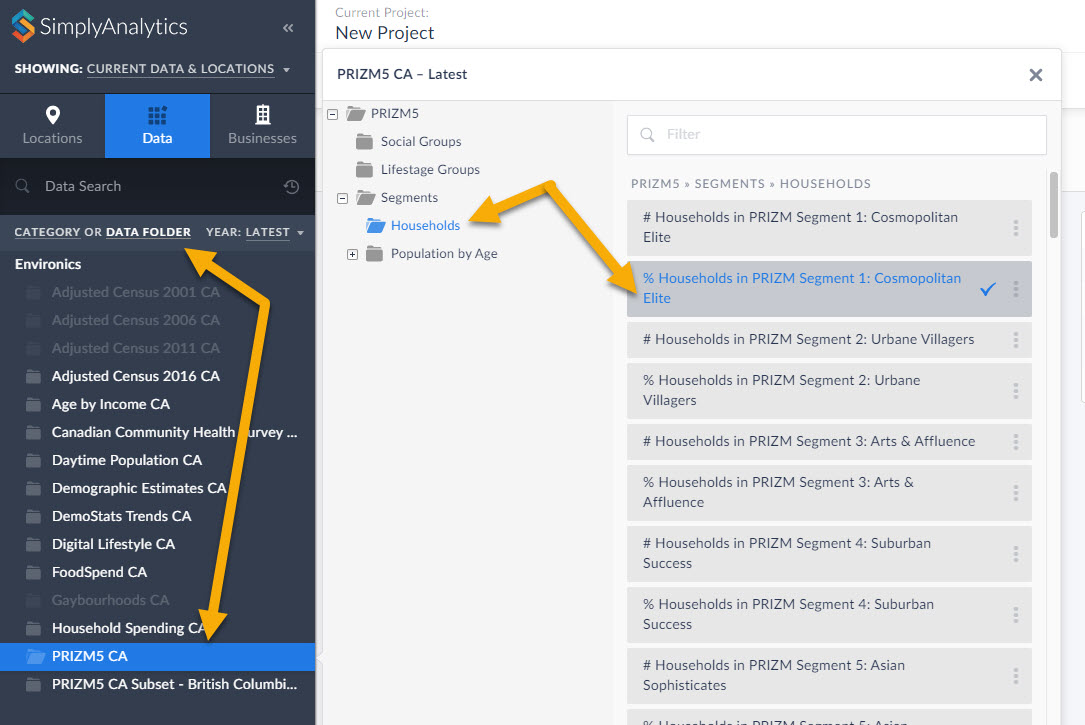
2.) Within the Data block, select any of the PRIZM segments, close the panel, and click on Done.
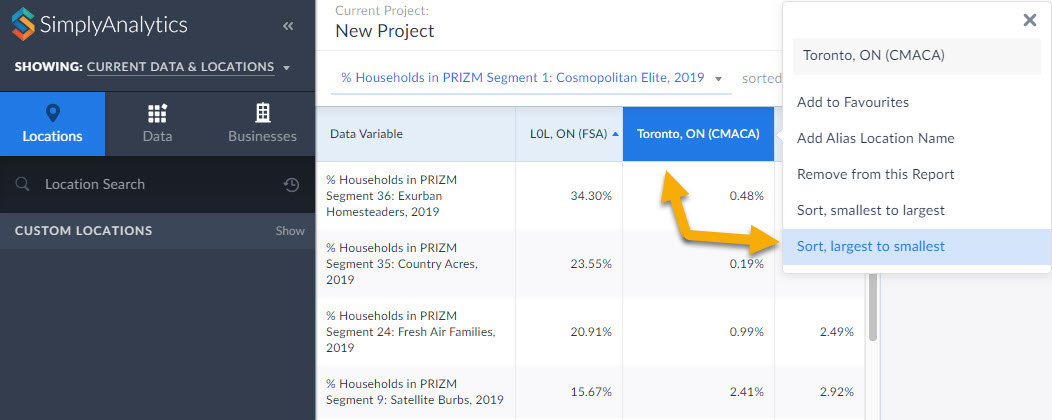
3.) The report will automatically add all PRIZM segments in the category you selected (households, in this case). Click on your location and Sort Descending to view the top segments in the given area. This is a powerful tool for users who want to market a product to a specific segment.
BONUS TIP: Within the Data Documentation page in the Support dropdown (top-right) users have access to the 2019 PRIZM Marketer's Handbook. Check out the super helpful Quick Reference PRIZM Guides on page 212 and 234. This is a great starting point for marketers to determine which PRIZM segments they want to focus on depending on age, children, urbancity, income, etc. For example, if you want high income suburban young families, you'd want Pets & PCs. You can favorite that PRIZM Segment, and use it in a Ranking Report to find out where all the Pets and PCs folks live in your requested geography.
That’s it for this week’s blog! Stay tuned for more.
More from SimplyAnalytics
Posted on Nov 22, 2016 by Admin
We will be exhibiting at ALA Midwinter in Atlanta, Georgia in January. You can find the GRI team at Booth 1155, where we will be catching up with customers old and new, and sharing some e...
Posted on Dec 15, 2014 by Admin
Custom Locations allow SimplyMap users to combine several locations into one larger region. For example, you can use this feature to combine three adjacent ZIP Codes to create your study ...
Posted on Nov 23, 2012 by Admin
Men's Health magazine is charting vanity in US cities, with help from SimplyMap. What did they find? The Sunshine State, with a long history of going to great lengths to look good, tops t...
Posted on Feb 27, 2009 by Admin
Geographic Research, Inc. is pleased to participate in the Statewide California Electronic Library Consortium's (SCELC) 12th Annual Vendor Day. SCELC members and librarians from other aca...
Posted on Nov 20, 2015 by Admin
In a previous blog we demonstrated the power of utilizing multiple years for the same variable. We found that the usage of Amazon.com had grown substationally from 2008-2014. In this week...
Posted on Mar 21, 2018 by Admin
The Quick Report is one of the newest features added to SimplyAnalytics - let’s take a look at how it can support your research. This report instantly provides you with a curated list of ...
Posted on Nov 29, 2009 by Admin
Legal Information Alert, a monthly newsletter covering what's new in legal publications, databases and research techniques, published a review of SimplyMap in their April 2009 issue title...
Posted on Feb 02, 2024 by Admin
We are excited to be back exhibiting at PLA this April in Columbus, OH. Join us at Booth #2631 to discover how SimplyAnalytics can help libraries understand their service area, assist sma...
Posted on Nov 29, 2009 by Admin
The ALA 2010 Midwinter Meeting will be held on January 15-19, 2010 at the Boston Convention and Exhibition Center. (Note that this is not the Hynes Convention Center). Geographic Research...
Posted on Oct 29, 2015 by Admin
Did you know that SimplyMap allows you to search for businesses by NAICS or SIC codes? Searching by these codes is a great alternative to the general keyword search. Using the keyword sea...