


Feature Highlight - Jump to Path
Posted on Sep 28, 2018 by Admin
Welcome readers! Today we have a quick feature highlight that will assist you in browsing and searching for data variables.
All data variables have a path where they reside within their datasets. For example, the data variable: % Education, College, Master's or Doctorate Degree can be found at this dataset path: Census Data » People and Households » Education » Attainment.
Each » reflects a different folder and subfolder. In the above example, the Attainment folder is within the Education folder that is found under People and Households within the Census Data.
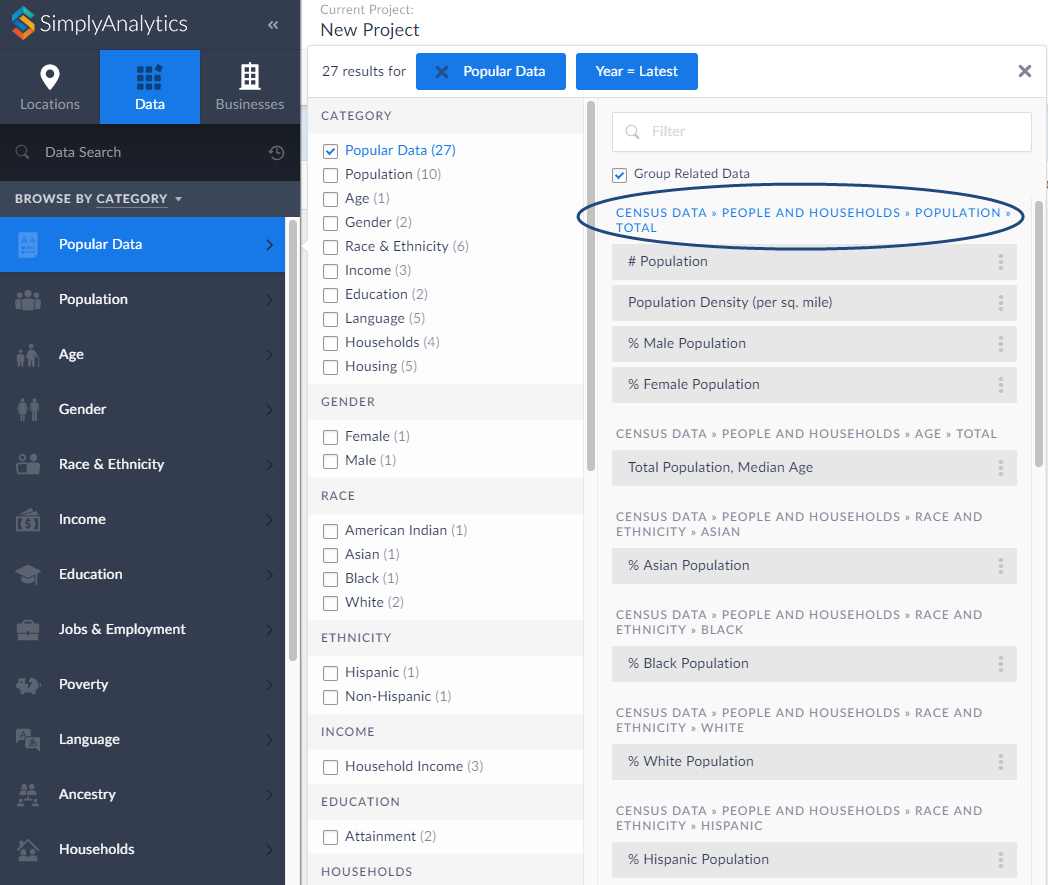
Did you know that you can jump into the folder directly from your category search? Simply click on the folder path at the top of the search results. as shown below:
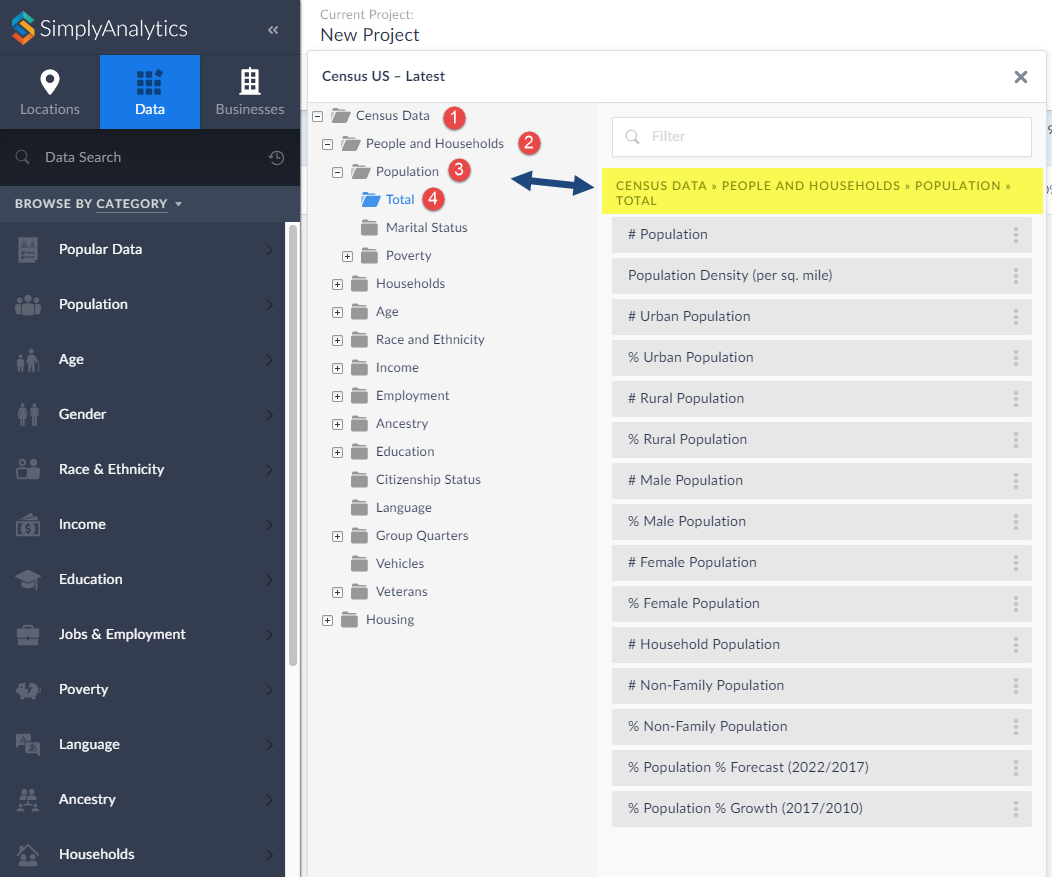
This will open up the folder where you can view all variables that reside there:
That’s all there is to it! We hope you enjoyed this quick tip today. Please feel free to reach out to us if you’d like to review a specific feature or data.
More from SimplyAnalytics
Posted on Apr 21, 2015 by Admin
In this week’s edition of exploring SimplyMap data, we spotlight the Consumer Buying Power® data package in SimplyMap. What is it? The Nielsen Consumer Buying Power® database incorporates...
Posted on Jul 22, 2015 by Admin
In this week’s SimplyMap report, we take a look at one of our newly available data packages - ConneXions® from Nielsen. The ConneXions® segmentation system integrates consumer behavior an...
Posted on May 15, 2015 by Admin
In this week’s SimplyMap report, we want to share with you the many options available when exporting maps in SimplyMap. In SimplyMap, when a user selects Export Map Image from the Actions...
Posted on Jul 09, 2009 by Admin
The American Library Association 2009 Annual Conference will take place in Chicago, IL from July 9- July 15, 2009 at McCormick Place West located at 2301 S. Lake Shore Drive Chicago, IL. ...
Posted on Jan 19, 2009 by Admin
The 2009 Midwinter Meeting will be held in Denver, CO, from Jan 23–28, 2009. http://www.ala.org/midwinter The exhibits will be held Jan 23–26, 2009 at the Colorado Convention Center,...
Posted on Oct 16, 2015 by Admin
Did you know that SimplyMap includes the ability to export Shapefile data for use in desktop mapping software (such as MapInfo or ArcGIS)? This advanced feature extends the power of Simpl...
Posted on Mar 22, 2016 by Admin
Inspired by some recent support desk questions, this week’s SimplyMap report will provide some useful tips and tricks to help make the most out of your maps. Let’s get started! First, let...
Posted on May 25, 2010 by Admin
The American Library Association 2010 Annual Conference is coming and the GRI team is gearing up for another great event this summer. We will be in Washington, D.C. again this year, June ...
Posted on Dec 16, 2015 by Admin
Visit the SimplyMap team at the ALA Midwinter Meeting 2016 in Boston. We will be at booth #1913 offering product demonstrations, tips & tricks, and of course Ghirardelli Chocolate! Ex...
Posted on Dec 15, 2014 by Admin
Visit the SimplyMap team at the ALA Midwinter Meeting in Chicago late January. We will be at booth #2824 offering product demonstrations, tips & tricks, and of course Ghirardelli Choc...