


Exploring SimplyMap Data: Consumer Buying Power
Posted on Apr 21, 2015 by Admin
In this week’s edition of exploring SimplyMap data, we spotlight the Consumer Buying Power® data package in SimplyMap.
What is it? The Nielsen Consumer Buying Power® database incorporates geography-based estimates of potential annual consumer spending for more than 350 household expenditure items.
This effectively allows researchers to determine a target area for potential consumers or buyers of a given type of product. Let’s take a look at an example.
Scenario: You want to identify target cities in Florida that would be most interested in home cooking products and appliances.
Using the CBP dataset, we can easily locate some target cities. Here’s how:
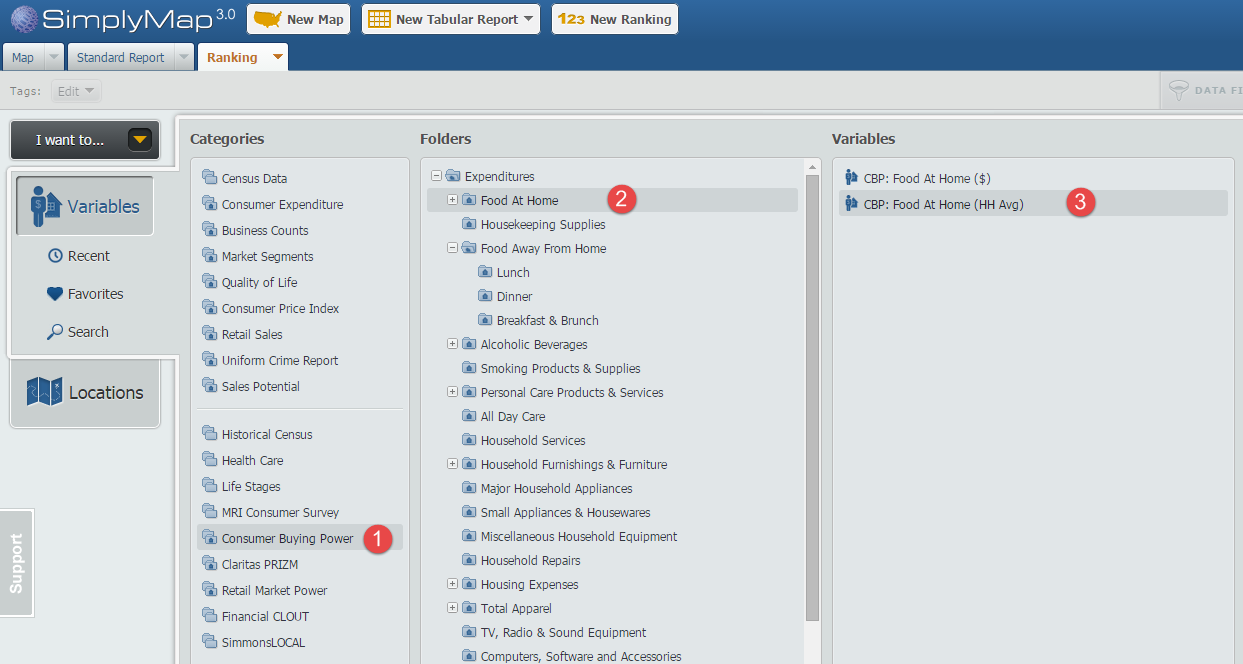
First, create a ranking report using Florida as the location. Next, navigate through the following path to select the variable, CBP: Food At Home (HH Avg).
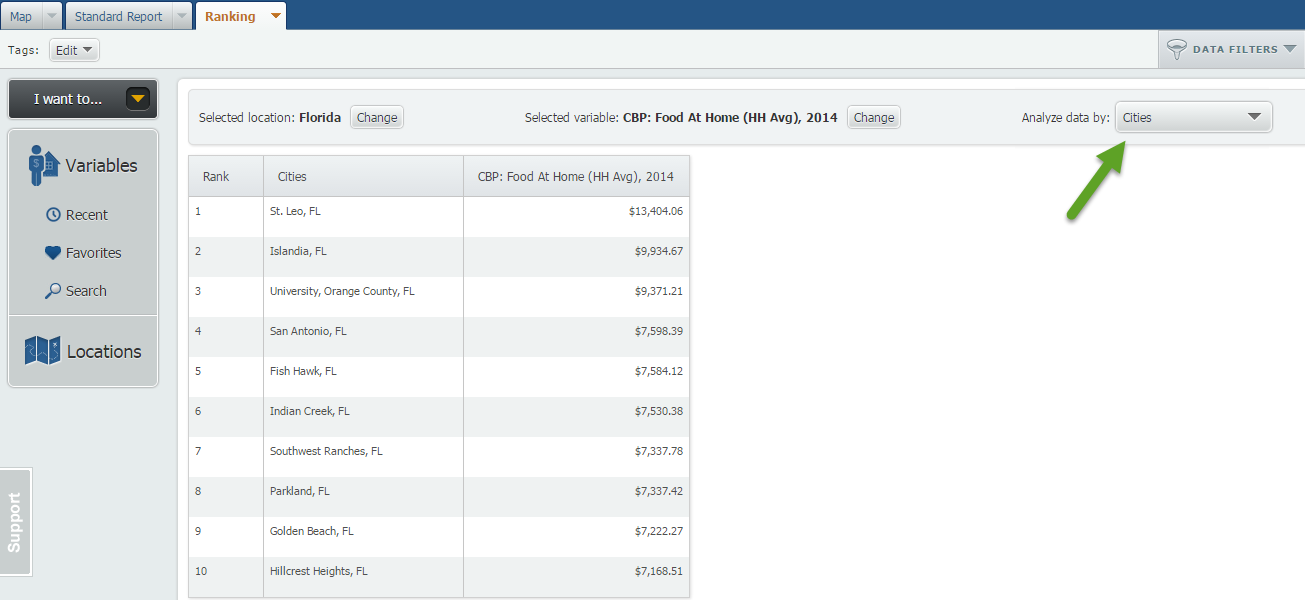
Next, use the Analyze Data By feature and select cities to reveal your target areas.
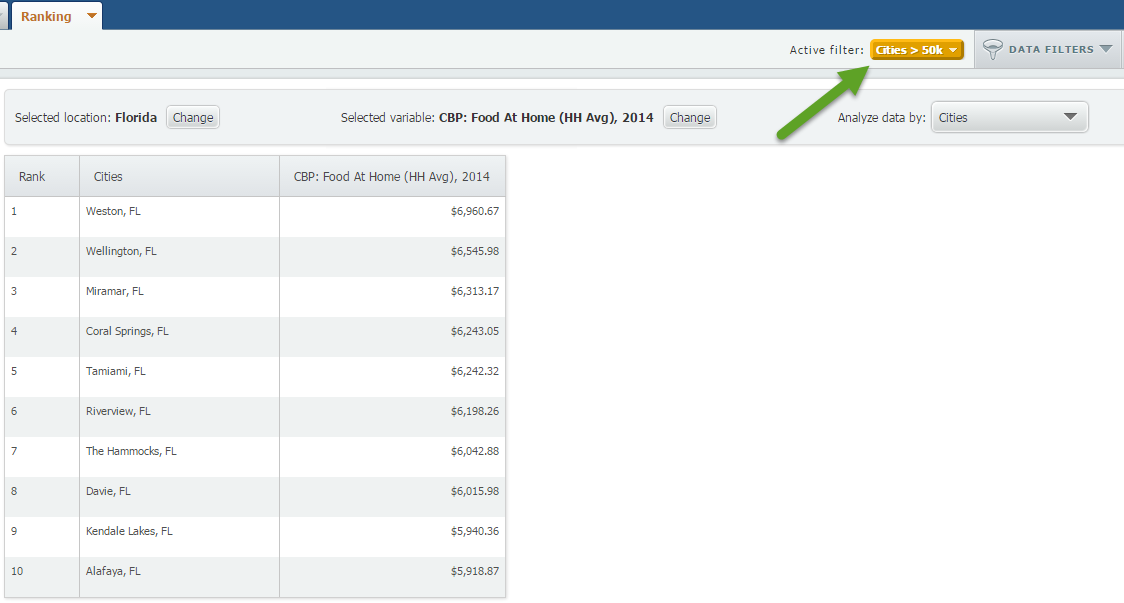
And that’s all there is to it! You might then be only interested in cities with a population of at least 50k. This can easily be done by applying a data filter (read more here). The new results are shown below:
Interested in specific maps or a particular dataset? Let us know!
More from SimplyAnalytics
Posted on Apr 30, 2024 by Admin
Congratulations to Brandyn Whitaker as the recipient of the 2024 BRASS Student Travel Award! Brandyn is a Library Services Associate in the Workforce and Economic Development department a...
Posted on Jan 23, 2024 by Admin
We are excited to again make the trip to Los Angeles for SCELCapalooza 2024 hosted at Loyola Marymount University! Please drop by our table on Wednesday, Feb. 28th to learn more about Sim...
Posted on Nov 29, 2009 by Admin
The ALA 2010 Midwinter Meeting will be held on January 15-19, 2010 at the Boston Convention and Exhibition Center. (Note that this is not the Hynes Convention Center). Geographic Research...
Posted on May 02, 2016 by Admin
Inspired by a recent support desk question, this week’s SimplyMap report will demonstrate how a user would run a business search that consists of multiple names. In short, the user was at...
Posted on Nov 06, 2014 by Admin
With over 75,000 variables in SimplyMap, you can find virtually any information you want. This week, we take a look at which U.S. locations spend the most money eating at restaurants or c...
Posted on Dec 12, 2011 by Admin
Men's Health magazine has published a ranked list to help readers find the cities where Americans are the saddest and where they are living with big smiles on their faces. As they note, "...
Posted on Feb 05, 2015 by Admin
In this week’s edition of exploring SimplyMap data, we take a look at America’s coffee drinkers. SimplyMap contains more than 100 coffee related variables, including consumer spending on ...
Posted on Oct 22, 2008 by Admin
Excerpt from University of Iowa Library blog: In your marketing class, you may be developing a marketing plan for a pre-made meals restaurant specializing in vegetarian menus in Chicagola...
Posted on Jun 21, 2022 by Admin
Hello readers! We hope you’re having a great day. Today we are featuring 5 commonly asked questions about the American Community Survey dataset that’s available to all customers in Simply...
Posted on Sep 27, 2019 by Admin
Hello readers! This week we provide an in-depth response to a question asking about the legend classification methods in SimplyAnalytics. This response is now part of our Help Center: htt...