


From the Help Desk - Analyzing all States at Once
Posted on Oct 08, 2019 by Admin
Hello readers! This week’s “From the Help Desk” is short & sweet. Let’s get to it!
Question: How do I analyze all of the states at once in a report?
Answer: The Ranking Report allows you to analyze all of the smaller geographic units in one larger area. For example, all the states in the USA, all of the Census Tracts in a County, etc.
Ranking Reports are a default view in your project, so there are only a few steps required.
1. Open the Ranking Report from the list of Views on the right side of the SimplyAnalytics window
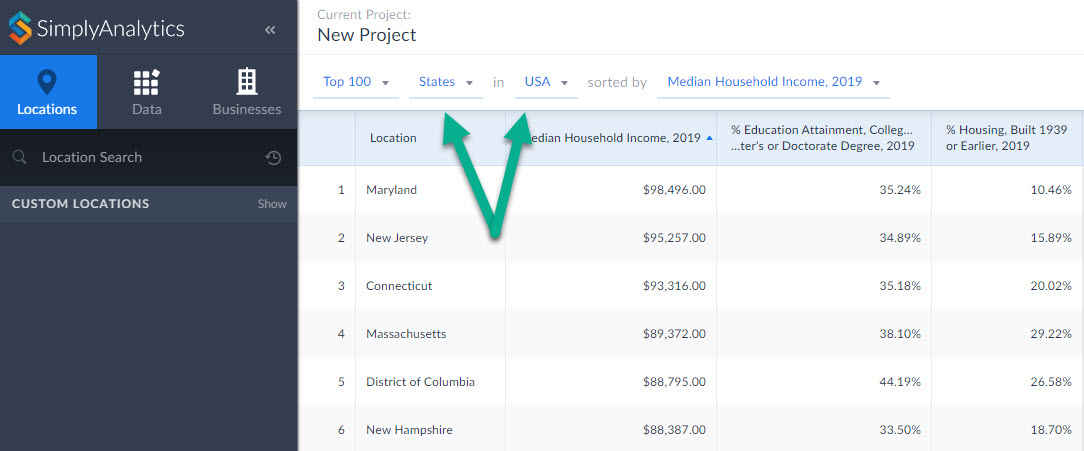
2. In your Ranking Report, set the location to be: USA
3. Set the appropriate dropdown to be: States
Your report will compile showing all the states in the USA. From there you are welcome to add in any variables of your choosing by selecting them from the list of recently used variables at the top of the report, or browsing the Data panel for additional variables.
That’s it for today! Stay tuned for more, and as always please do not hesitate to reach out to us with your questions to: support@simplyanalytics.com
More from SimplyAnalytics
Posted on Jan 23, 2015 by Admin
SimplyMap offers a total of 5 unique types of reports: Standard Report, Ranking Report, Business Report, Ring Study, and Location Analysis. This brief write up will define what each repor...
Posted on Jan 10, 2024 by Admin
We are delighted to announce our sponsorship of the Midwest Entrepreneurship Case Competition! At SimplyAnalytics, we understand the power of data-driven decision-making in entrepreneursh...
Posted on Jul 20, 2020 by Admin
Hello readers! We hope you are doing well and staying safe. Today we are excited to introduce the Simmons NCS crosstabs functionality! This is a feature we’ve been working on for a while,...
Posted on May 03, 2011 by Admin
The GRI team is very excited to announce the launch of SimplyMap 2.0! Completely redesigned, it is now easier than ever to access data and create professional quality thematic maps and re...
Posted on Jun 08, 2015 by Admin
In this week’s report we take a look at one folder found within SimplyMap’s SimmonsLOCAL data package. SimmonsLOCAL is a powerful targeting and profiling system that provides insights int...
Posted on Aug 26, 2015 by Admin
Most people in the United States could probably guess which cities are popular amongst tourists - Los Angeles and New York. But can you guess how much money is spent in novelty and souven...
Posted on May 28, 2009 by Admin
The Charleston Advisor, which publishes critical reviews of online resources for libraries, published a review of SimplyMap in April. We are very pleased to have received 4 1/4 stars out...
Posted on Feb 21, 2018 by Admin
We are looking forward to attending our first Electronic Resources & Libraries (ER&L) conference in Austin, TX! Visit us at Table #510 for a closer look at SimplyAnalytics – the b...
Posted on May 16, 2022 by Admin
Hello readers! We hope you are having a wonderful day. Today we feature a question from the help desk that we think many users would find useful. Let’s get started. The question: How can ...
Posted on May 26, 2020 by Admin
Hello readers! We hope you are doing well, and thank you for your continued support of SimplyAnalytics. We are excited to announce that scatterplots are officially live! Scatter plots ar...