


Feature Highlight: Data Filters
Posted on Apr 23, 2018 by Admin
Hello everyone and welcome to this week’s blog. This week we will discuss how to create and utilize filters for your research.
Why Use a Filter?
Filters are a great way to identify target areas that meet multiple conditions.
Use Case
You want to identify areas of San Antonio to market your afterschool program that is aimed towards low income and low educational attainment areas. You can use a data filter to help find the target areas.
Example
First, we will identify the target areas by creating an income filter and mapping the education attainment variable. Let’s get started.
1.Create the project by entering the target location for analysis in the Location field. In this example, the city of San Antonio, TX.
2. Map the variable % Education, College, Masters or Doctorate Degree. This is one of the 3 default data variables available when creating a project.
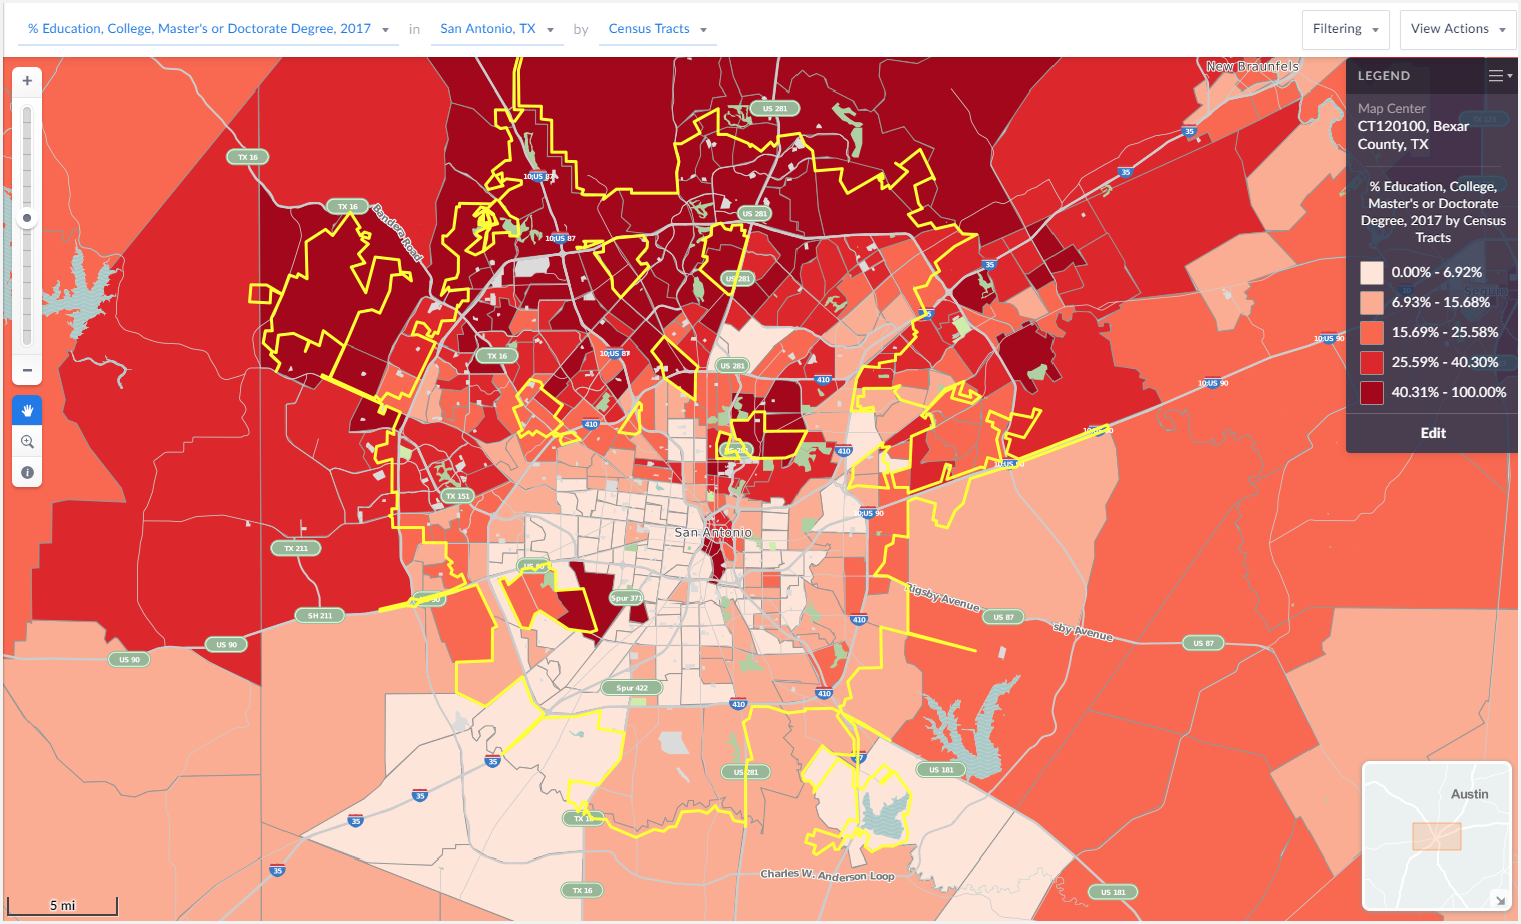
The darker areas of the map represent highly educated areas whereas the lighter areas reflect areas where a smaller percentage of residents have a college degree.
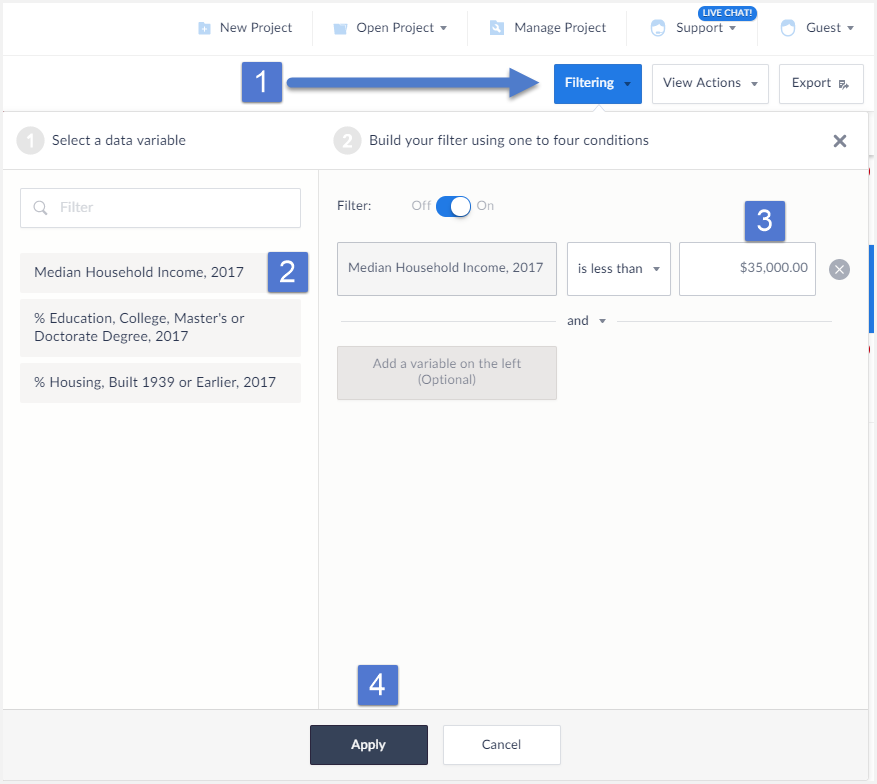
Next, create the income data filter.
- Select Filtering from the top Right of the interface. This will bring up the filter menu.
- Select a variable to act as a condition, in this example we want the Median Income variable.
- Enter a value for the condition (less than $35,000) and select Apply.
The filter gets applied to your map.
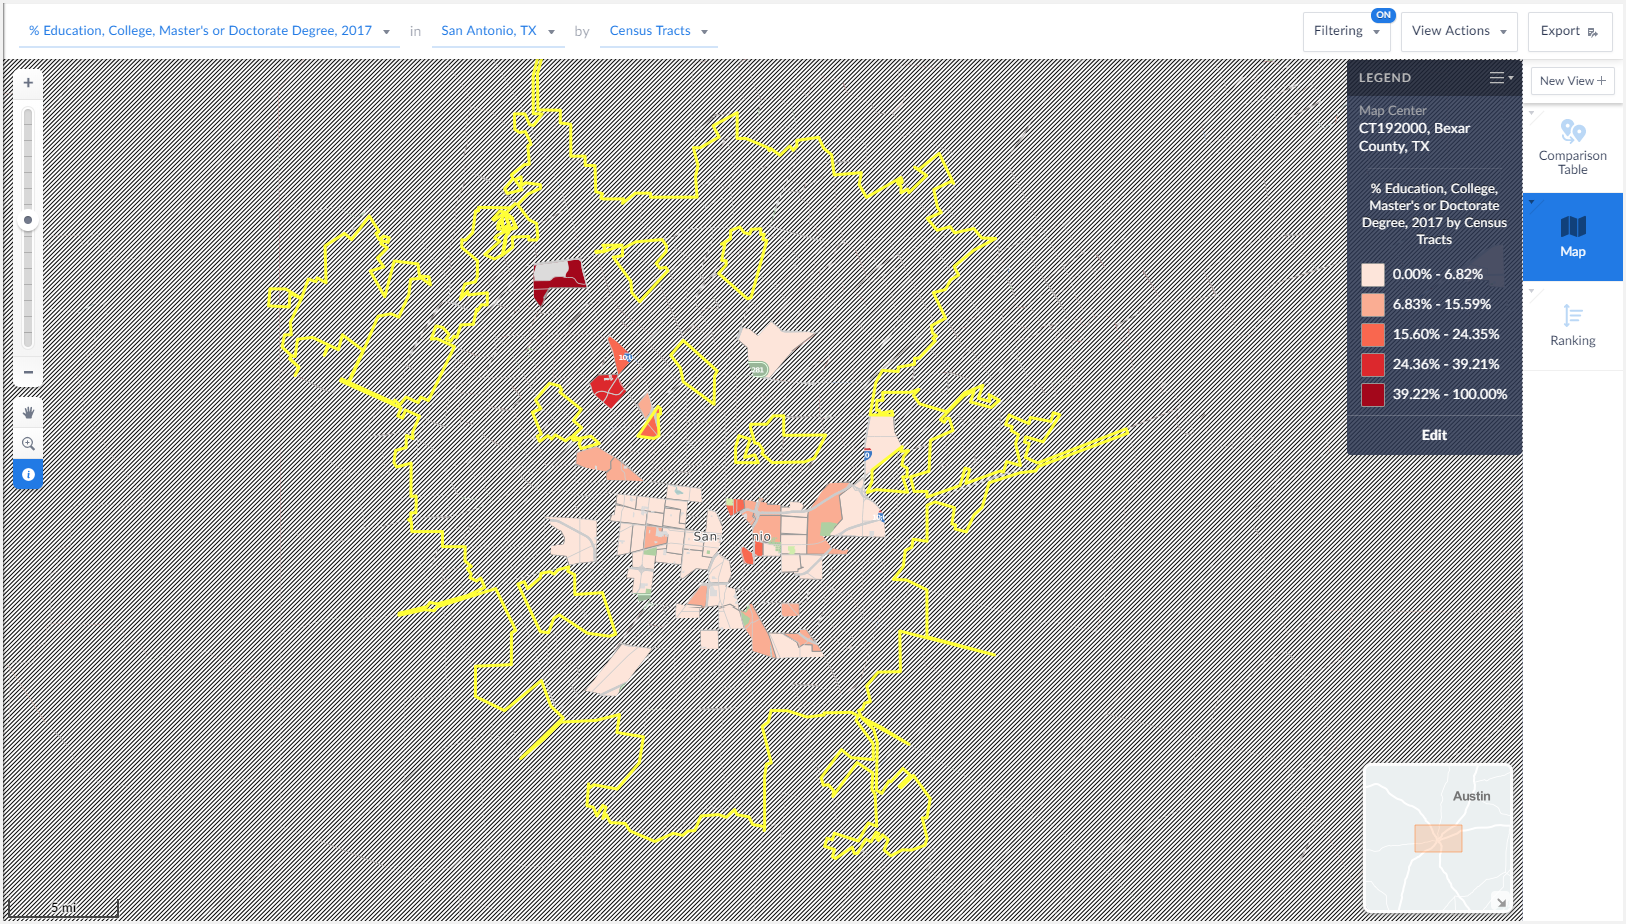
The final map image above reveals Census Tracts that meet our income criteria - looking at the still visible mapped areas provides the user with some ideal locations to market their program to.
That’s it for this week’s report! Stay tuned for more SimplyAnalytics how-tos and tips and send us your questions at support@simplyanalytics.com. If we feature your question in a future blog post, we’ll treat you to a $10 Starbucks gift card!
More from SimplyAnalytics
Posted on Feb 05, 2015 by Admin
Our Winter Sweepstakes has begun! Enter to win an iPad Mini 3 or Kindle Fire. How to Enter: Follow @SimplyMap on Twitter Like our SimplyMap Facebook Page for a 2nd Chance to Win If you ...
Posted on May 17, 2012 by Admin
We will be exhibiting at the American Library Association (ALA) Conference in Anaheim Friday June 22nd - Monday June 25th. Visit us at Booth 421 to learn more about SimplyMap and enter ou...
Posted on Jun 08, 2023 by Admin
We are excited to announce Mansi Nishit Trivedi as the winner of the 2023 BRASS Student Travel Award sponsored by SimplyAnalytics! Mansi, a Master of Information student at Dalhousie, has...
Posted on Jun 27, 2009 by Admin
The library faculty at Regent University in Virginia recently spotlighted SimplyMap in their Library Faculty Recommendations blog, highlighting its powerful ability to create professional...
Posted on Dec 07, 2021 by Admin
Hello readers! We hope you are enjoying the holiday season as much as we are. Today, we are happy to announce a couple of improvements to SimplyAnalytics designed to help you get your res...
Posted on Apr 05, 2019 by Admin
Come visit the SimplyAnalytics booth (325) at the upcoming ACRL 2019 show in Cleveland! Say hello, grab a chocolate, and stay for a quick demo of SimplyAnalytics. The team will be showcas...
Posted on Jul 22, 2015 by Admin
In this week’s SimplyMap report, we take a look at one of our newly available data packages - ConneXions® from Nielsen. The ConneXions® segmentation system integrates consumer behavior an...
Posted on Jan 07, 2015 by Admin
In this week’s exploration of SimplyMap data, we set out to find which cities in the United States have the highest percentage of older houses. To determine this, we used the variable “% ...
Posted on Jul 09, 2015 by Admin
In this week’s SimplyMap report, we set out to find which cities have the highest percentages of people who use their bike as their mode of transportation to work in the US. Let’s get sta...
Posted on Feb 24, 2019 by Admin
Visit with the SimplyAnalytics team at this year's 14th annual Electronic Resources & Libraries Conference in Austin, TX! You can find us at Table 207, where we will be available to a...