


SimplyMap Tip: Using a Radius Location
Posted on Mar 02, 2015 by Admin
In this week’s SimplyMap tip, we outline the process of creating a radius location. Radius locations are a great way to quickly gather information from an area surrounding a target address or neighborhood. In this example, we want to pull information from a 3 mile radius around a university campus.
First, open the locations panel in SimplyMap and Find location by: Block Groups. Next, Find the block group by address. When SimplyMap finds your location, select Create custom location and choose Radius.
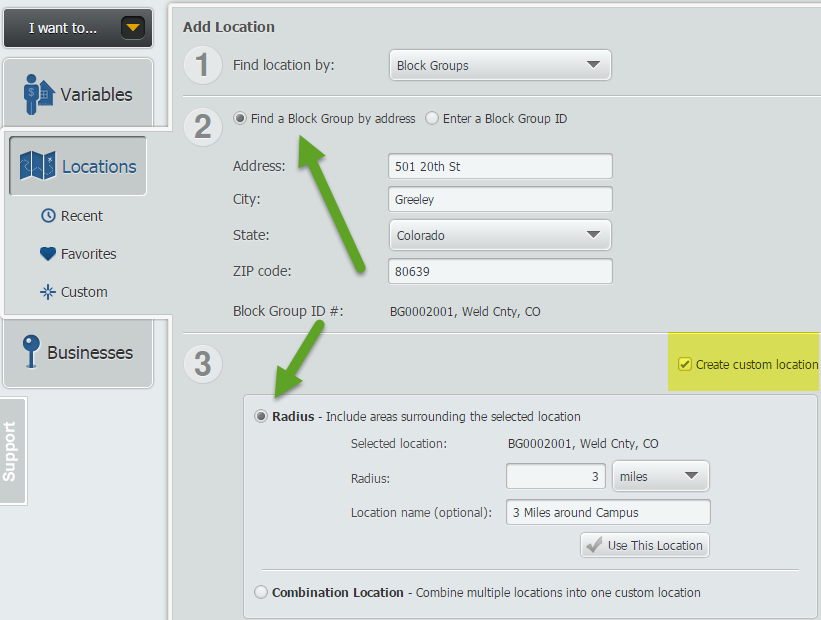
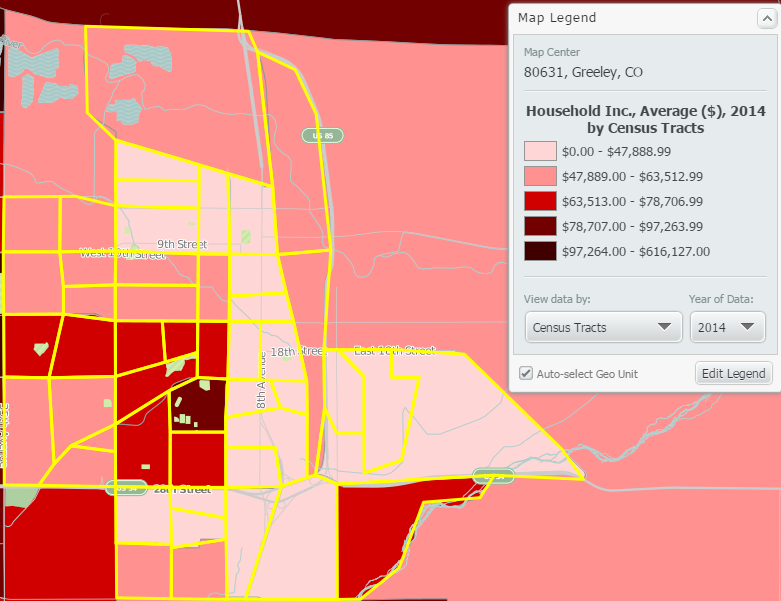
Enter your value in the available box, and give this location a name. Select Use This Location, and pick a variable of your choosing to quickly create a map. SimplyMap will generate a 3 mile radius around the address entered, as shown below.
Another great feature of radius locations is that they function as a custom location that can be used for reports. To quickly make a report, select Actions > Make Ranking from Map.
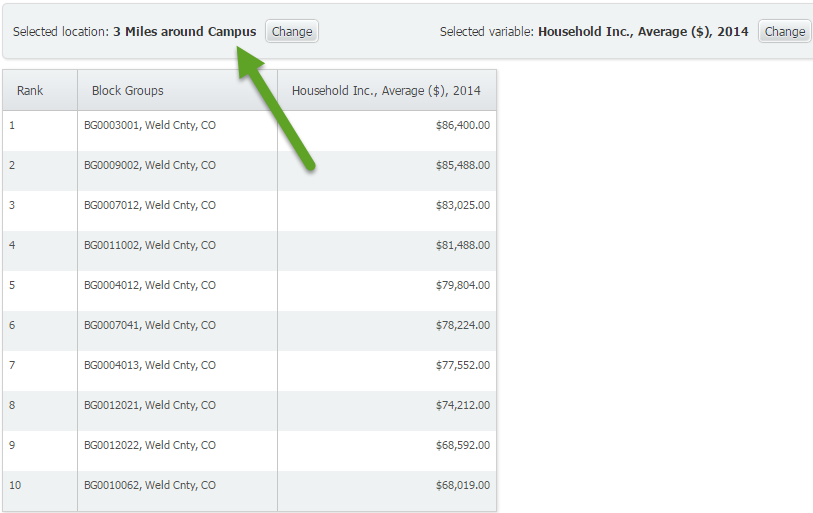
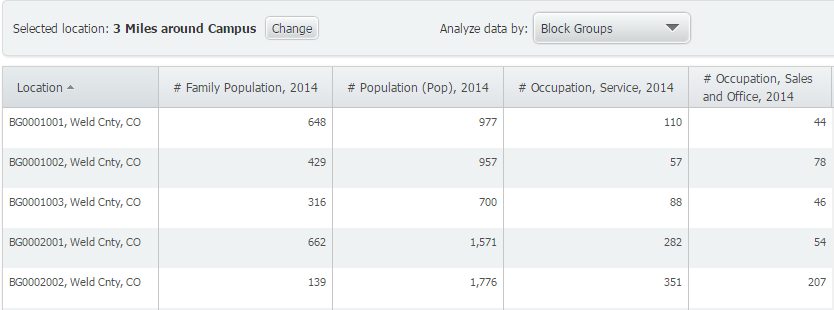
This will generate a ranking report of all the smaller geographies within the 3 mile radius from campus. Similarly, you can create a Standard Report or Location Analysis report using your new radius location.
Standard Report with Radius Location
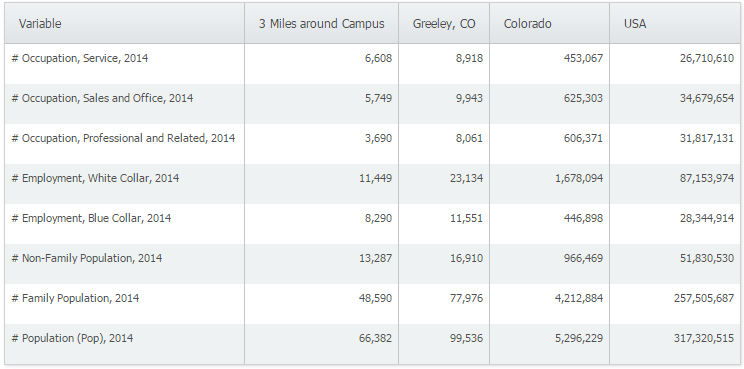
Location Analysis Report with Radius Location
We hope you found this week’s SimplyMap tip to be helpful. Stay tuned for more!
Have you already entered for your chance to win an iPad or Kindle Fire? We will be holding the drawing on April 17, 2015. To enter, simply follow us on Twitter and Like Us on Facebook to get your name in consideration.
More from SimplyAnalytics
Posted on Feb 24, 2019 by Admin
We will be exhibiting at SCELC* Vendor Day on March 14th. Visit us at table 510 and attend one of our two sessions demonstrating SimplyAnalytics. The presentations will highlight newly av...
Posted on Jun 02, 2016 by Admin
Three weeks ago we utilized the SimmonsLOCAL data set to visualize contiguous America’s mayonnaise brand preference. Staying with the American visualization theme, this week’s report will...
Posted on Jun 02, 2017 by Admin
We can't wait for ALA Annual this Summer, and the opportunity to share SimplyAnalytics with the ALA community. Stop by the SimplyAnalytics booth (1339) and take a peak at what we've been ...
Posted on Aug 22, 2009 by Admin
Lynda Kellam, the Data Services & Government Information Librarian at the University of North Carolina, Greensboro has produced some new tutorial videos to help students learn how to ...
Posted on Nov 06, 2019 by Admin
Hello readers! We hope you’re having a wonderful week. Today we feature another entry from our From the Help Desk series. Let’s get started! Question: How do I analyze data for downtown? ...
Posted on Oct 12, 2010 by Admin
NC LIVE, a member-driven library service organization dedicated to providing online information services that support education, enhance statewide economic development, and increase qu...
Posted on Jun 21, 2019 by Admin
Come visit the SimplyAnalytics booth (#3010) at the upcoming ALA 2019 show in Washington, D.C.! Our team will be on hand offering quick demos of SimplyAnalytics, answering questions and s...
Posted on Jun 05, 2025 by Admin
We’re excited to announce that SimplyAnalytics will be exhibiting at the American Library Association (ALA) Annual Conference in Philadelphia! We’re thrilled to showcase how SimplyAnalyti...
Posted on Jun 09, 2016 by Admin
In this week’s blog, we’ll be featuring our newest data offering, PRIZM® Premier. If your institution currently subscribes to PRIZM data, this new module is available at no additional cos...
Posted on Dec 06, 2009 by Admin
ALA's Choice Magazine, publisher of independent reviews of products and services for academic libraries, released a new review of SimplyMap in the December 2009 edition. The reviewer, Car...