


Creating a Custom Location from a Map
Posted on Sep 15, 2016 by Admin
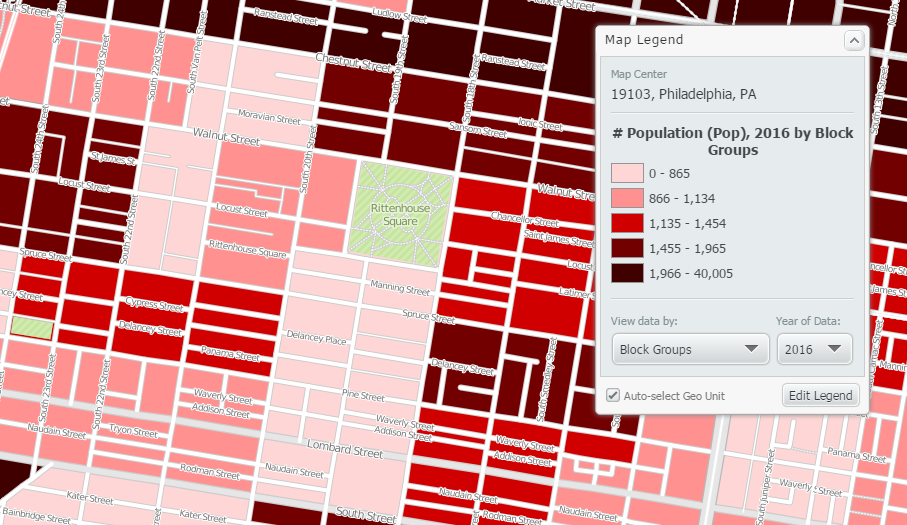
While creating a radius location is the fastest and easiest method for creating a custom location, there may be situations that require a more specific and targeted locale. Let’s say for example that our target area for analysis are a few neighborhoods located west of Rittenhouse Square Park in Philadelphia.
A radius location would not work in this example as it will include all areas within a defined radius (e.g., 5 miles) around a specific block group. Using the process outlined below will allow you to focus in on the specific areas west of Rittenhouse Square Park, and create a custom location directly from a map. Let’s get started!
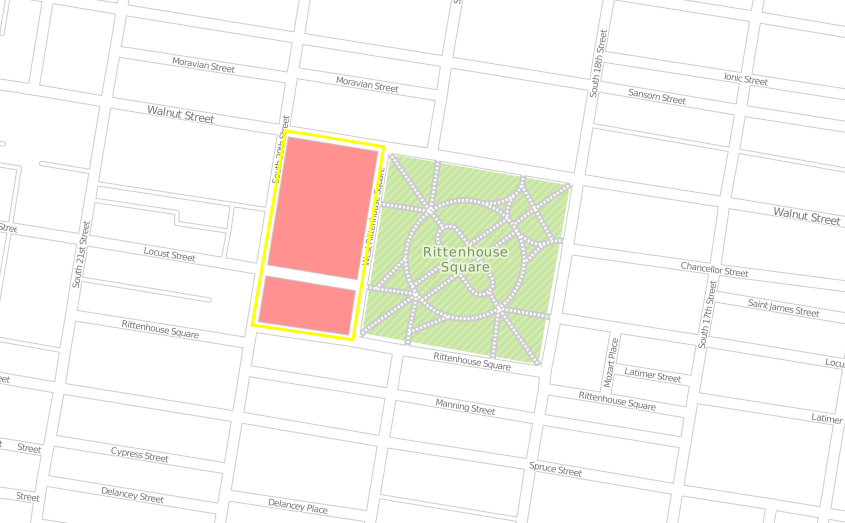
First, zoom in on the target area that will make up the custom location.
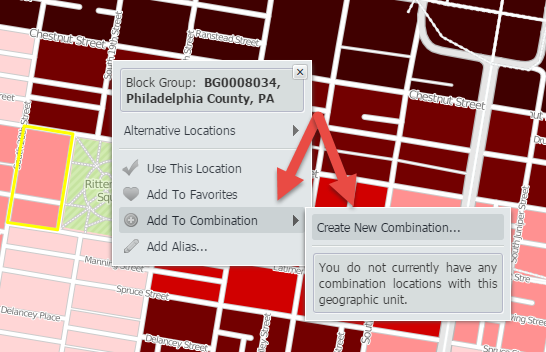
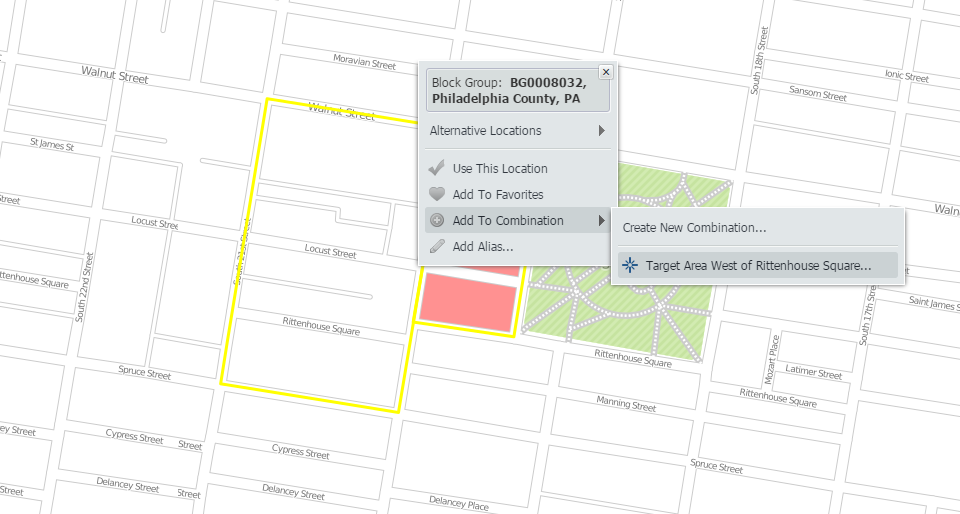
Utilize the i-tool and select the first area that will be included in your custom location. Hover over Add to Combination to select the option Create New Combination.
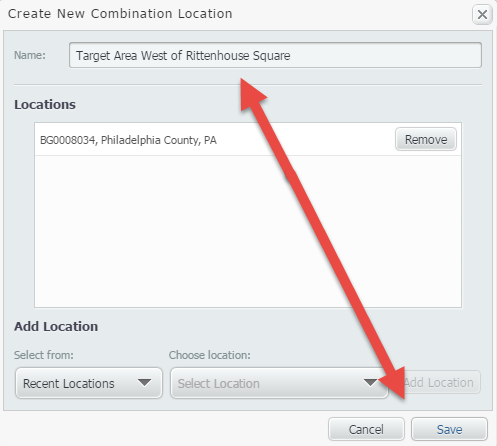
Give your location a name, and click save.
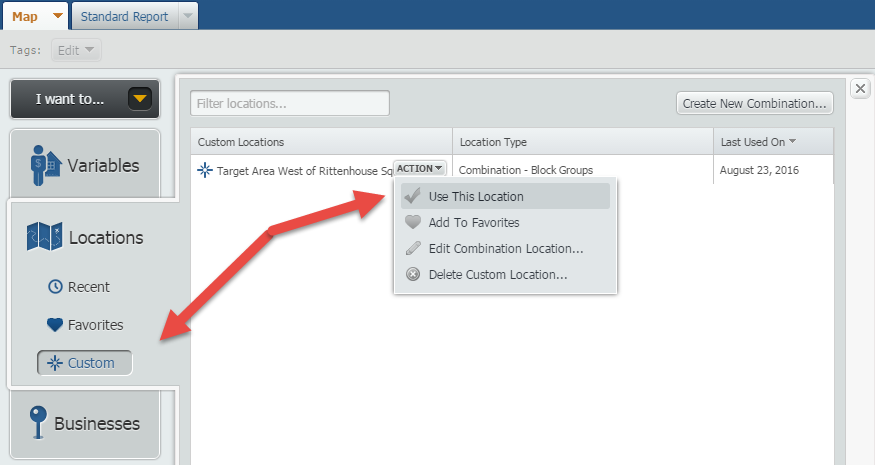
With the Combination now created, open the Locations panel, click on Custom and use the newly created combination.
Your map will now look like this (with the one location we clicked on earlier):
Note: We applied a Location Mask to remove colors outside of our target area (shown in white now).
Use the i-tool once more, and repeat the process above adding new locations into the combination location:
Final result:
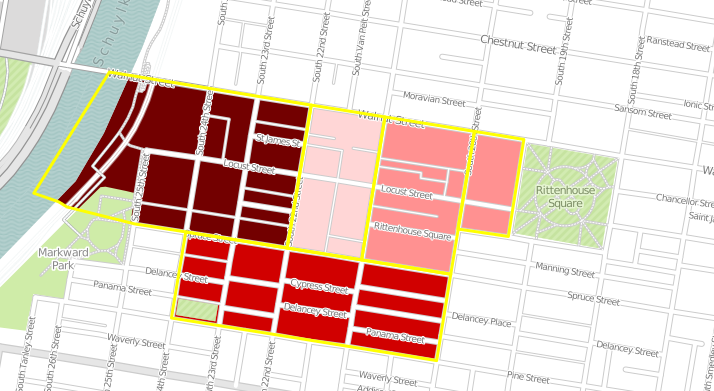
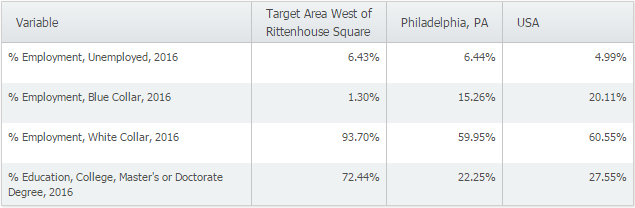
With the target area now created, you can utilize it in both maps and reports for further analysis.
Stay tuned for more SimplyMap tips and how-to’s!
More from SimplyAnalytics
Posted on Jan 27, 2015 by Admin
In this week’s report exploring SimplyMap data, we take a look at where America’s bookworms reside. To find this data, we used the variable, Reading (Household Average), 2014 found in the...
Posted on Jun 07, 2011 by Admin
We will be exhibiting at the Special Library Association Annual Conference in Philadelphia and the American Library Association conference in New Orleans later this month. Come and visit ...
Posted on May 28, 2009 by Admin
The Charleston Advisor, which publishes critical reviews of online resources for libraries, published a review of SimplyMap in April. We are very pleased to have received 4 1/4 stars out...
Posted on Dec 08, 2017 by Admin
Good afternoon, readers! This week we’re going to talk about project management in SimplyAnalytics and how to best take advantage of it. Why are projects needed? Many users have multiple...
Posted on Apr 21, 2015 by Admin
In this week’s edition of exploring SimplyMap data, we spotlight the Consumer Buying Power® data package in SimplyMap. What is it? The Nielsen Consumer Buying Power® database incorporates...
Posted on Jun 01, 2014 by Admin
Visit the SimplyMap team at the ALA Annual Conference and Exposition in Las Vegas later this month. We will be at booth 1271, offering product demonstrations, tips & tricks, and of co...
Posted on Nov 28, 2012 by Admin
Come visit the SimplyMap team at the ALA Midwinter Meeting, January 25 - 28, 2013 in Seattle, WA. We will be in Booth 1307, and as always we look forward to meeting with customers new and...
Posted on Sep 05, 2019 by Admin
We are pleased to be exhibiting again at the Charleston Library Conference, on Tuesday November 5th, 2019. The Vendor Showcase will be held in the Gaillard Center Grand Ballroom (95 Calho...
Posted on Dec 08, 2010 by Admin
The GRI team will be attending the American Library Association Midwinter meeting this year at the San Diego Convention Center. Visit us in booth 1055 in the exhibit hall from January 7 -...
Posted on Dec 11, 2015 by Admin
With the final week of the college football season in the books, and bowl game selections having just taken place, we wanted to search within SimplyMap to see if any data pertaining to co...