 Go up
Go up


College Bowl Game Data
Posted on Dec 11, 2015 by Admin
With the final week of the college football season in the books, and bowl game selections having just taken place, we wanted to search within SimplyMap to see if any data pertaining to college football bowl games is available. Here’s what we found.
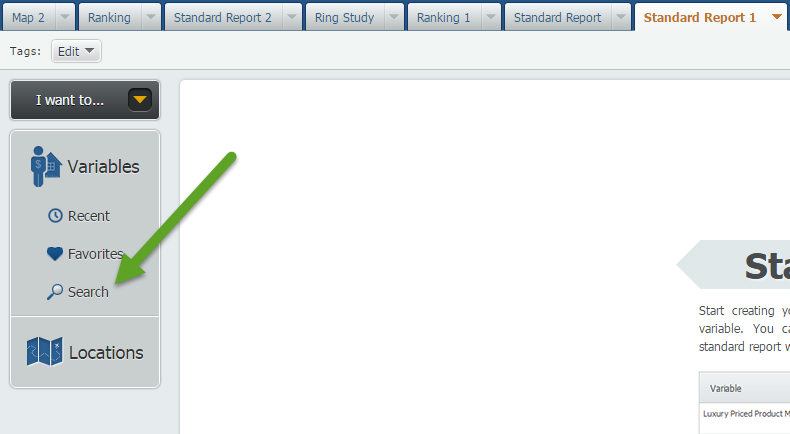
To start, open up the search function within the Variables panel.
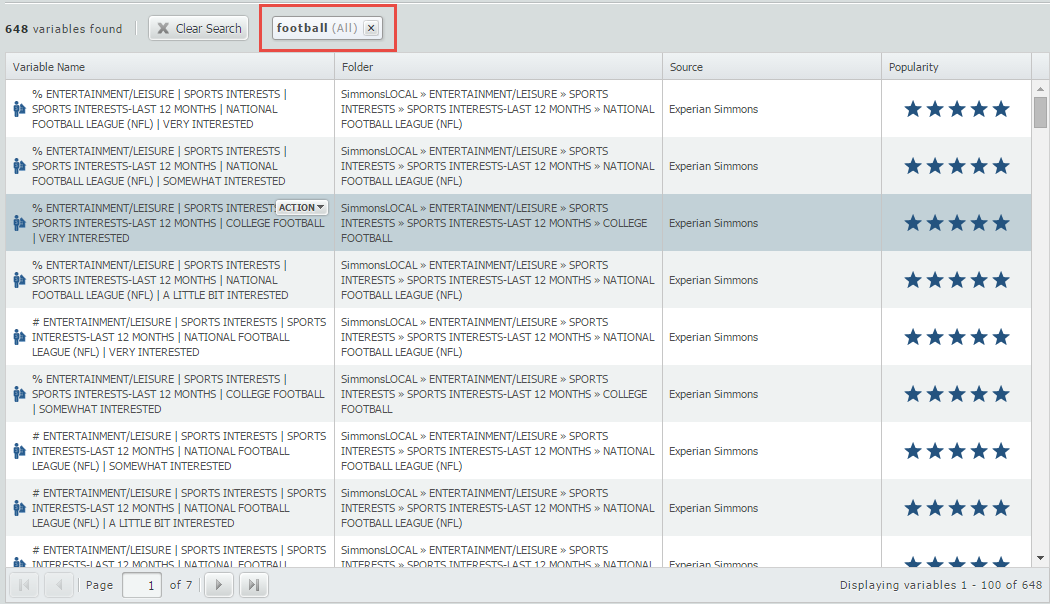
In a previous post, we covered how to use the variable search function to search for multiple terms. First, we searched for “football”.
Not surprising, the results yielded a large number of football related variables at 648.
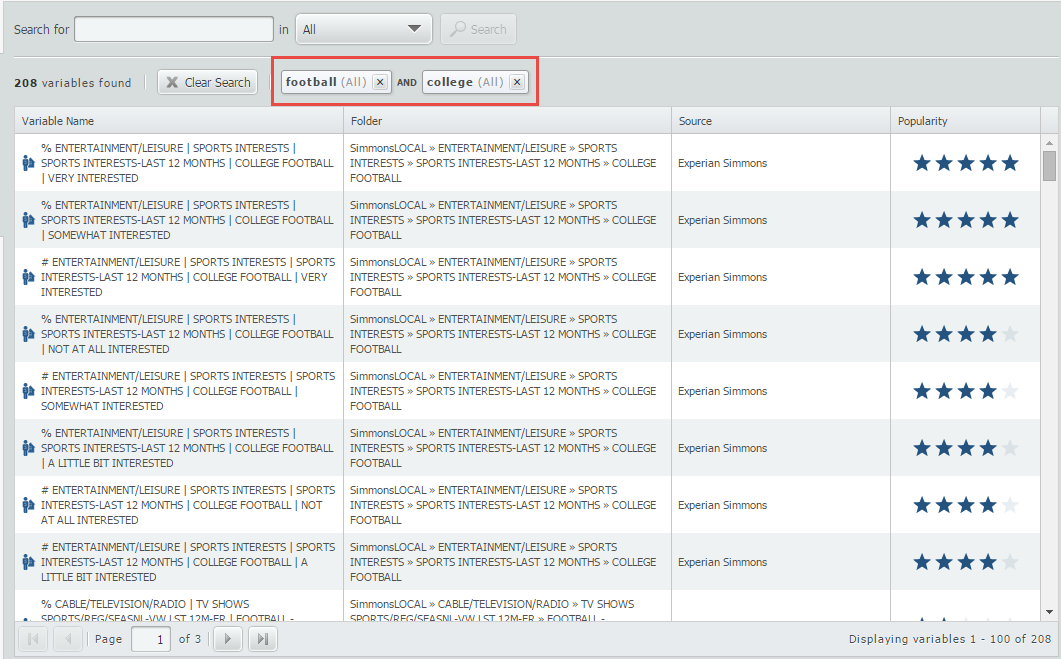
Next, enter an additional keyword: “college,” and click Search. This narrows our results down to a more manageable (but still a large sum!) 208 variables.
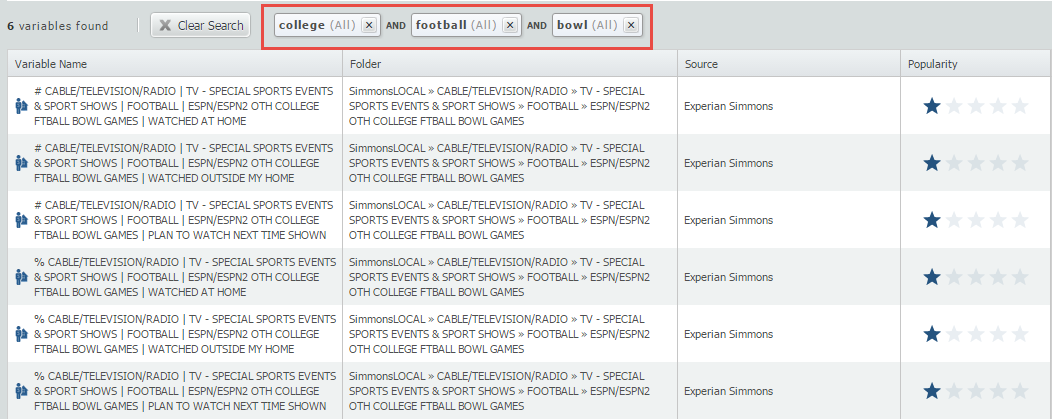
Lastly, add the word “bowl” into your search and there it is - the final list of variables related to college bowl games.
Let’s add these variables into a Standard Report for the US:
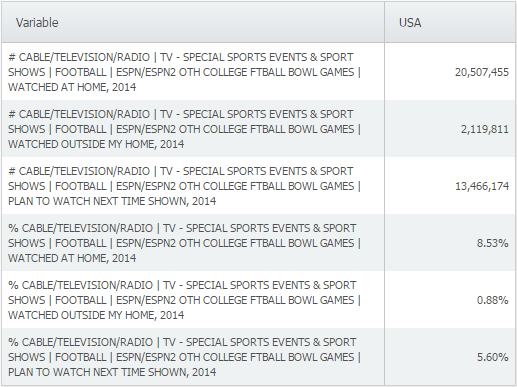
America does indeed love its college football, with over 20,000,000 folks watching bowl games from home, and another 2,000,000 watching outside of their home last year!
We hope you enjoyed this week’s SimplyMap report. Stay tuned for more!
More from SimplyAnalytics


Posted on Apr 17, 2009 by Admin
The Special Libraries Association will hold its Annual Conference in Washington, DC at the Washington Walter E. Washington Convention Center from June 14-17 2009. The conference will crea...
Posted on Nov 29, 2009 by Admin
Legal Information Alert, a monthly newsletter covering what's new in legal publications, databases and research techniques, published a review of SimplyMap in their April 2009 issue title...
Posted on Oct 07, 2013 by Admin
Do you know the quickest way to find the name of a Block Group, Census Tract or ZIP code in our upcoming release for 3.0? The i-Tool gives you the ability to click anywhere on a map to g...
Posted on Sep 15, 2016 by Admin
While creating a radius location is the fastest and easiest method for creating a custom location, there may be situations that require a more specific and targeted locale. Let’s say for ...
Posted on Mar 21, 2018 by Admin
The Quick Report is one of the newest features added to SimplyAnalytics - let’s take a look at how it can support your research. This report instantly provides you with a curated list of ...
Posted on Feb 21, 2018 by Admin
We are looking forward to attending our first Electronic Resources & Libraries (ER&L) conference in Austin, TX! Visit us at Table #510 for a closer look at SimplyAnalytics – the b...
Posted on Jul 22, 2015 by Admin
In this week’s SimplyMap report, we take a look at one of our newly available data packages - ConneXions® from Nielsen. The ConneXions® segmentation system integrates consumer behavior an...
Posted on Jan 07, 2015 by Admin
In this week’s exploration of SimplyMap data, we set out to find which cities in the United States have the highest percentage of older houses. To determine this, we used the variable “% ...
Posted on Jan 29, 2016 by Admin
In a previous blog entry, we highlighted the benefits of having multiple years of data available for the same variable. This allows users to identify trends over time. Keeping with the sa...
Posted on Mar 22, 2016 by Admin
Inspired by some recent support desk questions, this week’s SimplyMap report will provide some useful tips and tricks to help make the most out of your maps. Let’s get started! First, let...