


Exploring SimplyMap Data: America’s Bookworms
Posted on Jan 27, 2015 by Admin
In this week’s report exploring SimplyMap data, we take a look at where America’s bookworms reside. To find this data, we used the variable, Reading (Household Average), 2014 found in the Consumer Expenditure folder. This variable encompasses all expenses used on magazine subscriptions, newspaper subscriptions, and books.
To make this report, we chose to utilize a Ranking Report. First, we took a look at the top 10 states:
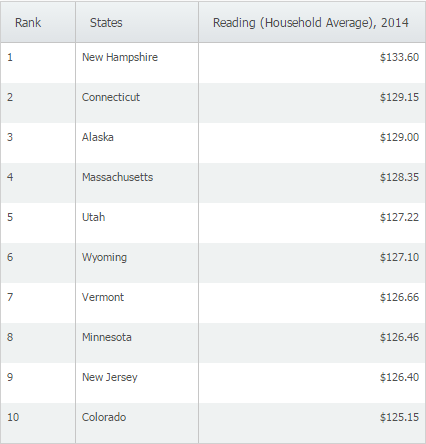
At a yearly household average of $133.60, the state of New Hampshire ranks first in the United States in spending on reading material. For reference, the United States at large totaled $116.85. Next, we applied a data filter to view cities with a population of more than 75,000. The results are as follows:
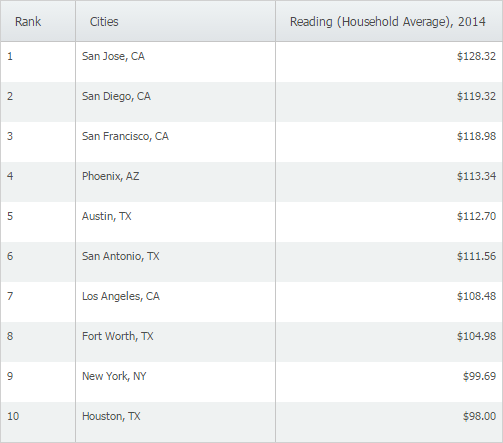
San Jose, CA ranks first in the United States for household spending on reading materials. California is also well represented in the top 10 with San Diego (2), San Francisco (3), and Los Angeles (7) also ranking in the top 10.
Stay tuned for more SimplyMap data reports and tips!
More from SimplyAnalytics
Posted on Sep 08, 2016 by Admin
One of our favorite uses of SimplyMap is to find data that validates our general assumptions and observations. For example, in a previous blog we wrote about the growth of tablet ownershi...
Posted on Oct 26, 2018 by Admin
Welcome readers! This week we’ll take a look at how to browse for data by category in SimplyAnalytics. Browsing by Category is the default way of browsing for data in SimplyAnalytics. It ...
Posted on Jun 05, 2025 by Admin
We’re excited to announce that SimplyAnalytics will be exhibiting at the American Library Association (ALA) Annual Conference in Philadelphia! We’re thrilled to showcase how SimplyAnalyti...
Posted on May 06, 2013 by Admin
The GRI team is looking forward to exhibiting at SLA 2013 at the San Diego Convention Center, June 9th through the 11th. The Special Libraries Association (SLA) is a nonprofit global orga...
Posted on Jun 08, 2015 by Admin
In this week’s report we take a look at one folder found within SimplyMap’s SimmonsLOCAL data package. SimmonsLOCAL is a powerful targeting and profiling system that provides insights int...
Posted on Nov 29, 2009 by Admin
Legal Information Alert, a monthly newsletter covering what's new in legal publications, databases and research techniques, published a review of SimplyMap in their April 2009 issue title...
Posted on Sep 14, 2021 by Admin
Welcome readers! Today we are excited to welcome histograms to SimplyAnalytics. We hope you enjoy this wonderful new visualization as much as we do. Let’s take a look. What is a histogram...
Posted on Mar 21, 2011 by Admin
Men's Health magazine decided to crown one town America's Most Socially Networked City, and has generated quite a buzz in the process. Their survey examined the number of Facebook and Li...
Posted on Sep 15, 2025 by Admin
SimplyAnalytics will be attending the upcoming NCLA Conference in Winston-Salem October 14-17!
Posted on Jul 26, 2016 by Admin
In this week’s SimplyMap report, we’ll take a look at the Retail Market Power dataset and provide a simple, effective example of how the data package can be used. If your institution curr...