


Browsing for Data Variables: Category Search
Posted on Oct 26, 2018 by Admin
Welcome readers! This week we’ll take a look at how to browse for data by category in SimplyAnalytics. Browsing by Category is the default way of browsing for data in SimplyAnalytics. It includes robust filtering capabilities to quickly find the specific data you are looking for from among the thousands of variables in the database.
Suppose we want to find the percentage of females who are employed in the healthcare industry.
First, select the broadest appropriate category - Jobs & Employment.
The top left of the panel displays how many variables are related to Jobs & Employment.
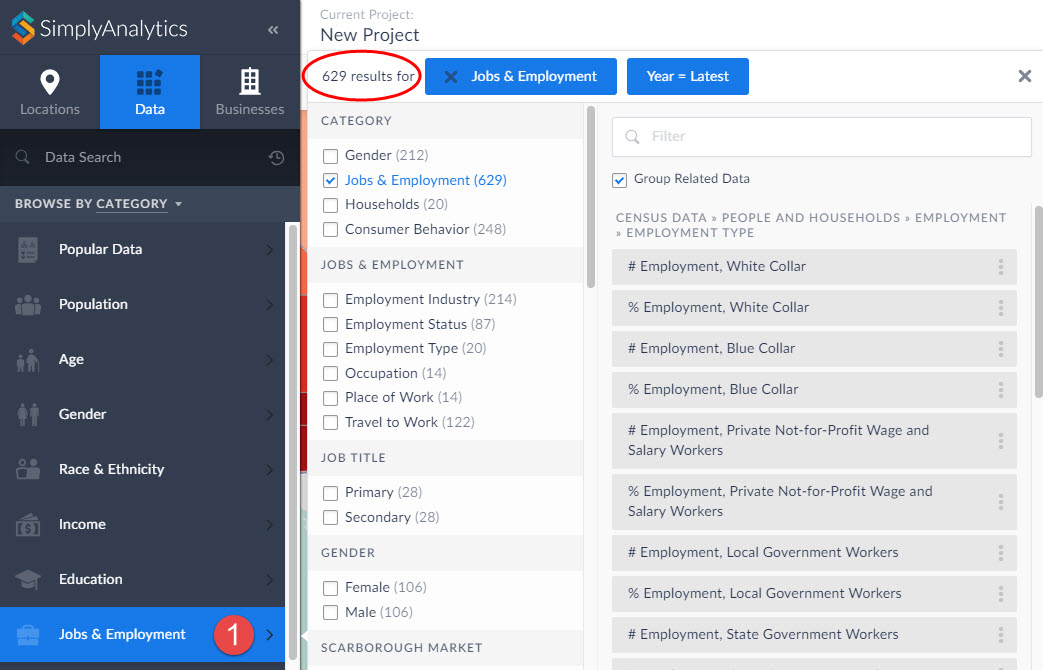
Notice in the image above you can search further within Jobs & Employment, and also specify a gender - scroll down to also choose a year, data type, and data set.
Click on the appropriate checkboxes to narrow down the options:
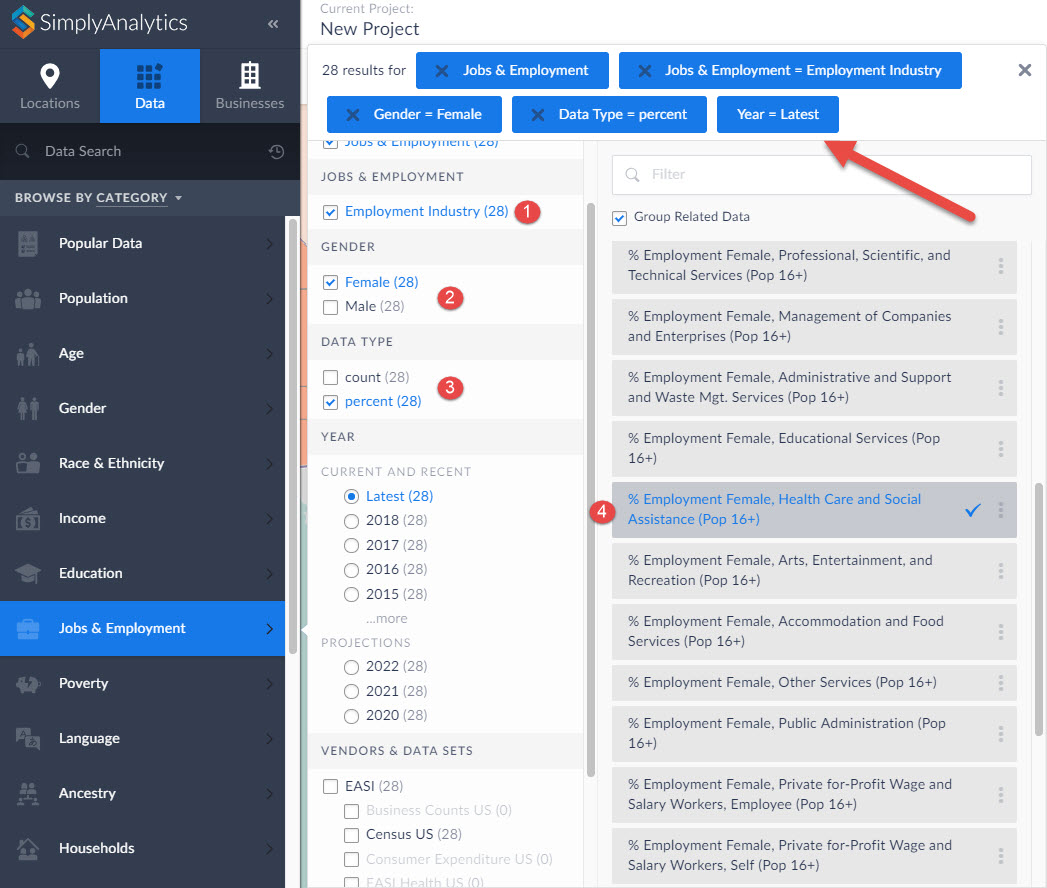
The list gets narrowed down to 28 results, and you can scroll down on the right-hand side to identify the target variable.
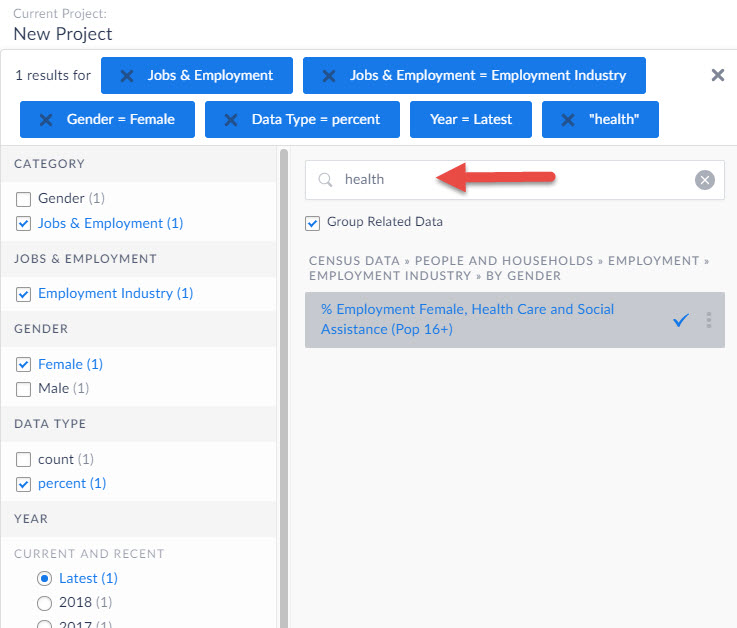
TIP: Notice the filter field within the panel - you can use this to quickly find specific data by entering a keyword in this field.
We hope you enjoyed this week’s write up - please let us know if there’s anything in particular you like to see in future posts!
More from SimplyAnalytics
Posted on May 18, 2015 by Admin
The SimplyMap team is looking forward to visiting with customers and others at the SLA Annual Conference, coming to Boston on June 14-16. Come visit us at Booth #916, we are happy to answ...
Posted on Feb 24, 2019 by Admin
We will be exhibiting at SCELC* Vendor Day on March 14th. Visit us at table 510 and attend one of our two sessions demonstrating SimplyAnalytics. The presentations will highlight newly av...
Posted on Nov 06, 2013 by Admin
SimplyMap includes a number of helpful support tools; guided wizards available when and where you need them, detailed help files, and an online support center with FAQs and searchable kno...
Posted on Jun 21, 2019 by Admin
Come visit the SimplyAnalytics booth (#3010) at the upcoming ALA 2019 show in Washington, D.C.! Our team will be on hand offering quick demos of SimplyAnalytics, answering questions and s...
Posted on Nov 03, 2017 by Admin
This week we’ll talk about one of our favorite features in SimplyAnalytics - the custom combination location. This feature is a simple and effective means to create custom geographies whe...
Posted on Jul 14, 2009 by Admin
Men's Health continues to utilize SimplyMap to identify and rank U.S. cities. This time they are studying "sports-obsessed citizenry," and here is how they did it: Our stat showdown began...
Posted on Oct 07, 2013 by Admin
Do you know the quickest way to find the name of a Block Group, Census Tract or ZIP code in our upcoming release for 3.0? The i-Tool gives you the ability to click anywhere on a map to g...
Posted on Apr 18, 2017 by Admin
We look forward to attending the Texas Library Association Conference this week in San Antonio and visiting with the library community. Stop by our new SimplyAnalytics booth (2029) and ta...
Posted on Nov 06, 2019 by Admin
Hello readers! We hope you’re having a wonderful week. Today we feature another entry from our From the Help Desk series. Let’s get started! Question: How do I analyze data for downtown? ...