


Exploring SimplyMap Data: Using the Internet to Make Phone Calls
Posted on Sep 08, 2016 by Admin
One of our favorite uses of SimplyMap is to find data that validates our general assumptions and observations. For example, in a previous blog we wrote about the growth of tablet ownership in the US and how the iPad dominates that area. It’s one thing to “know” that tablet ownership has grown, but it’s another thing to view the supporting data behind it.
This week, let’s explore another variable we presume has markedly increased in recent years - the % of Households who used the internet to make a phone call. Let’s get started!
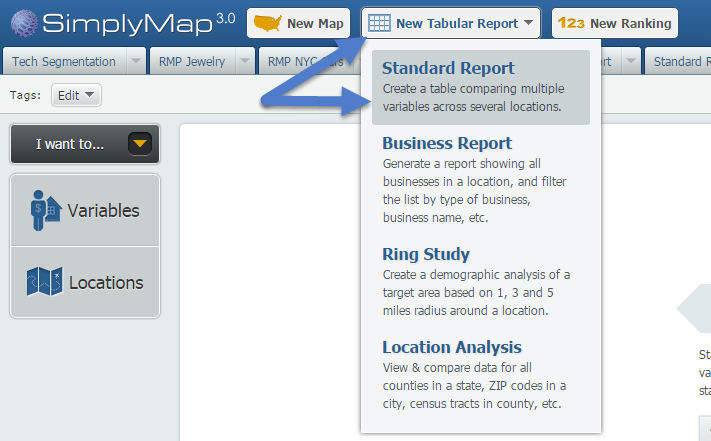
Open up a Standard Report via the New Tabular Report button at the top of SimplyMap:
Navigate through this path: MRI Consumer Survey » Internet » Internet Access and Activities to find the variable, % Households Using - Internet Activities: Made a phone call, 2015.
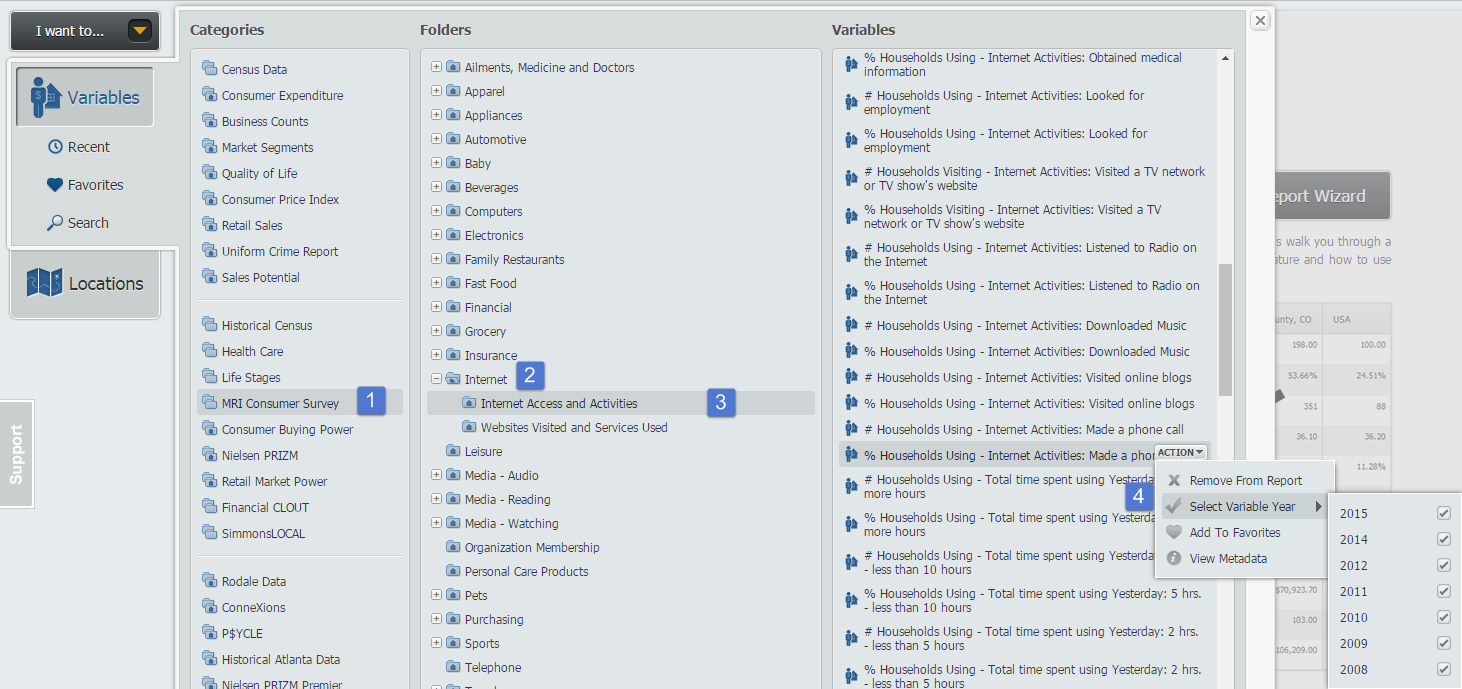
Hover over the Action menu on the variable and select the available years from the Select Variable Year option, shown above.
Close out the Variables panel to generate your report. Results below!
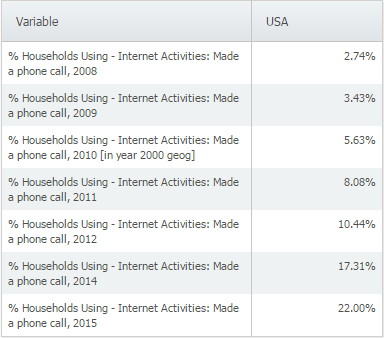
It looks like using the internet to make a phone call has exploded in recent years, from 2.7% in 2008 to 22% in 2015. Why do you think this is? Aside from the availability of the internet in general, it could be due to the rise in tablets, FaceTime and Skype.
Stay tuned for more in this series, and let us know if there’s anything within SimplyMap you’d like to see written about!
More from SimplyAnalytics
Posted on Jun 05, 2025 by Admin
We’re excited to announce that SimplyAnalytics will be exhibiting at the American Library Association (ALA) Annual Conference in Philadelphia! We’re thrilled to showcase how SimplyAnalyti...
Posted on Oct 27, 2017 by Admin
Welcome to our first ever SimplyAnalytics blog! Every Friday we’ll post a write up on a specific feature or highlight some interesting data in SimplyAnalytics. The goal of these posts is ...
Posted on Jun 09, 2021 by Admin
Hello readers! SimplyAnalytics will be exhibiting at the Virtual ALA Annual Conference this year on June 23-26. Be sure to drop by our booth, and click the banner image to video chat with...
Posted on Jun 11, 2026 by Admin
SimplyAnalytics is excited to exhibit at ALA Annual 2026 in Chicago! Visit us at Booth #4336 to meet our team, ask questions, and learn more about the latest SimplyAnalytics features and ...
Posted on Sep 21, 2009 by Admin
The North Carolina Library Association will hold its annual conference in Greenville, NC at the Greenville Convention Center from October 6-8, 2009. Geographic Research, Inc. will be exhi...
Posted on Sep 15, 2016 by Admin
While creating a radius location is the fastest and easiest method for creating a custom location, there may be situations that require a more specific and targeted locale. Let’s say for ...
Posted on Nov 04, 2013 by Admin
SimplyMap 3.0 is here, and uses the latest technology to provide better performance, improved reliability, and powerful new features. There are many improvements designed to make it easie...
Posted on Dec 19, 2016 by Admin
Stop by the Geographic Research booth [#T8] at the Ontario Library Association Super Conference to get a hands-on look at our latest and greatest SimplyMap offering. The conference will t...
Posted on Sep 15, 2025 by Admin
SimplyAnalytics will be attending the upcoming NCLA Conference in Winston-Salem October 14-17!
Posted on Jan 19, 2009 by Admin
The 2009 Midwinter Meeting will be held in Denver, CO, from Jan 23–28, 2009. http://www.ala.org/midwinter The exhibits will be held Jan 23–26, 2009 at the Colorado Convention Center,...