


Managing Projects in SimplyAnalytics
Posted on Dec 08, 2017 by Admin
Good afternoon, readers! This week we’re going to talk about project management in SimplyAnalytics and how to best take advantage of it.
Why are projects needed?
Many users have multiple unique projects going on at the same time. For example, you could be doing: personal research, patron/student assistance, research for a presentation, etc. Projects help keep these unique activities separate from one another to avoid confusion.
What is stored in each project?
All of the locations, variables, business searches, favorites, views, etc. that you use are saved with the project - so each time you login, you can pick up right where you left off.
Getting Started:
The first recommendation we have is to rename your project. You can do this by selecting the “New Project” default title towards the top left of your screen.
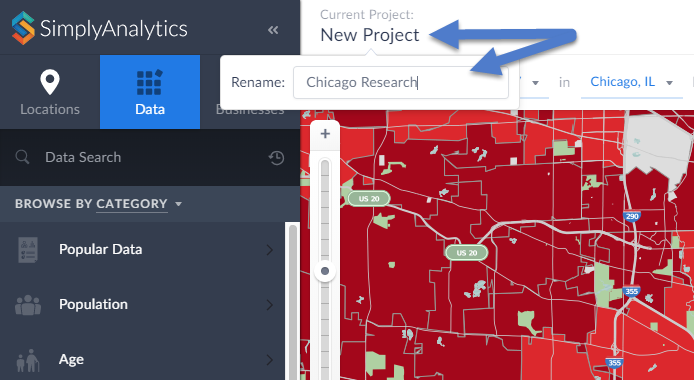
Enter a new name within the available text field and hit Enter to save your current project.
Managing Your Project:
Select Manage Project from the top-right of your screen. From here you will have some editing options available:
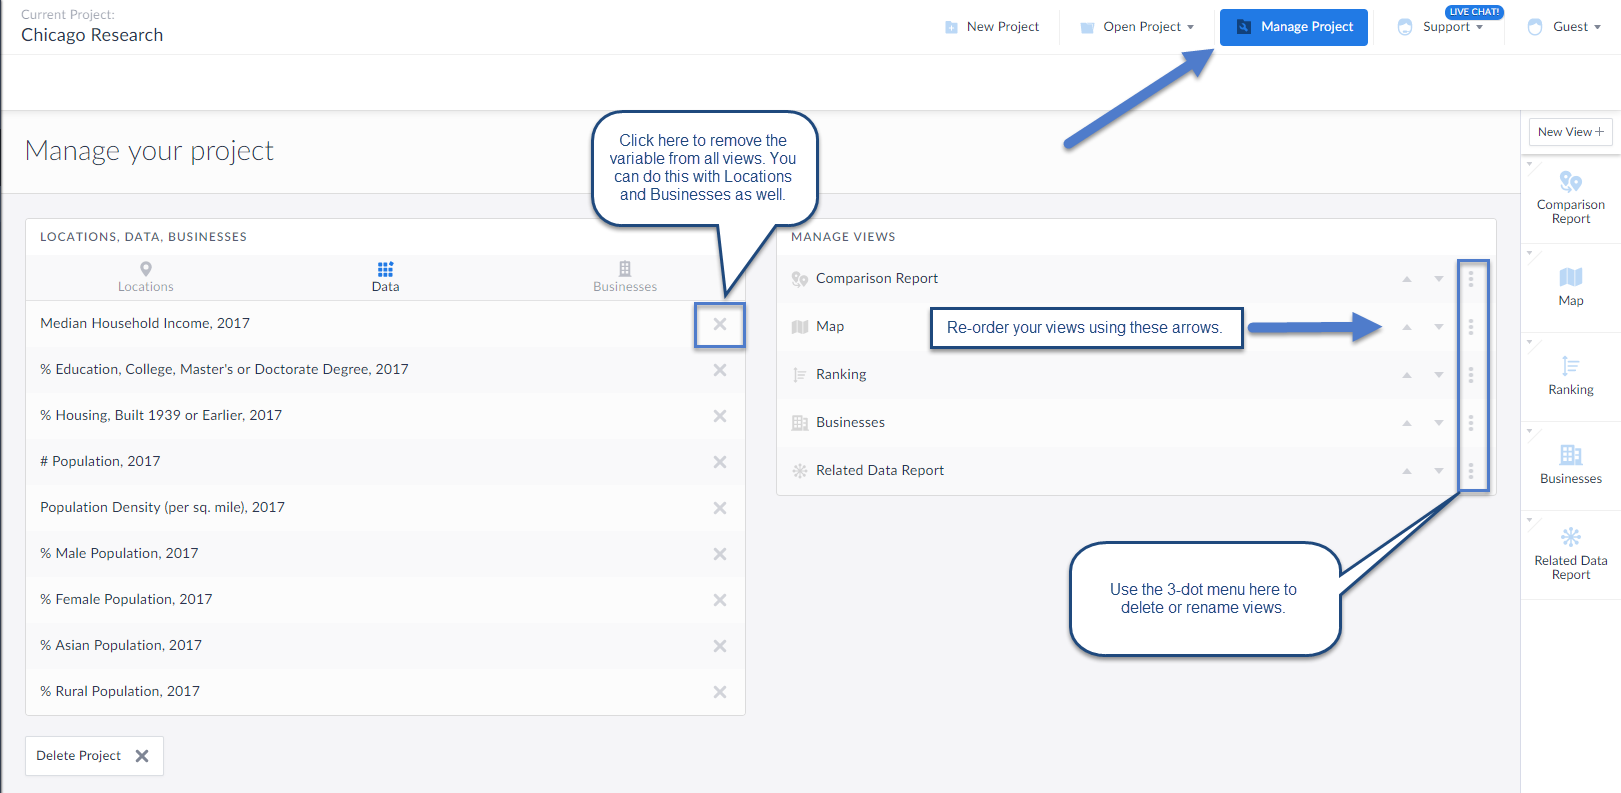
You can choose to remove any locations, data variables or searches within your project using the options available towards the left of your workspace. This will remove those items from all views they reside in along with removing them from the Edit View screen.
Manage Views: The three-dot menu within this area will allow you to delete or rename the view. Additionally, the up and down arrows will allow you to arrange your views in order of how they appear on the right-hand side of the interface.
Creating a New Project: Select New Project to get started with a brand new project (no locations, variables, searches).
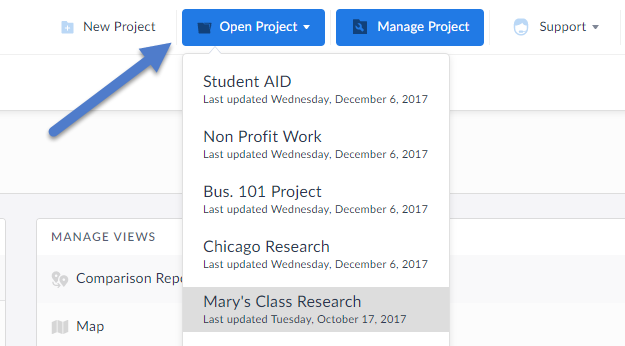
You can always select Open Project to toggle back to older projects.
That’s it for this week’s blog, stay tuned for more!
More from SimplyAnalytics
Posted on Dec 11, 2015 by Admin
With the final week of the college football season in the books, and bowl game selections having just taken place, we wanted to search within SimplyMap to see if any data pertaining to co...
Posted on Jan 23, 2015 by Admin
SimplyMap offers a total of 5 unique types of reports: Standard Report, Ranking Report, Business Report, Ring Study, and Location Analysis. This brief write up will define what each repor...
Posted on May 24, 2023 by Admin
SimplyAnalytics is excited to attend. Swing by booth 1733 for a brief demo, and discover how our user-friendly demographics, business, health & marketing data analytics and visualizat...
Posted on Jul 20, 2020 by Admin
Hello readers! We hope you are doing well and staying safe. Today we are excited to introduce the Simmons NCS crosstabs functionality! This is a feature we’ve been working on for a while,...
Posted on Sep 15, 2025 by Admin
SimplyAnalytics will be attending the upcoming NCLA Conference in Winston-Salem October 14-17!
Posted on Jun 09, 2021 by Admin
Hello readers! SimplyAnalytics will be exhibiting at the Virtual ALA Annual Conference this year on June 23-26. Be sure to drop by our booth, and click the banner image to video chat with...
Posted on Jul 30, 2018 by Admin
Hello readers! Welcome to this week’s blog. This week we will feature the Related Data Table view and how you can use it to maximize your productivity in SimplyAnalytics. What is it? The ...
Posted on Dec 02, 2014 by Admin
Today we take a look at one of the more advanced features in SimplyMap - editing the map legend. Editing the map legend is a great way to not only customize how the data is distributed on...
Posted on Apr 30, 2024 by Admin
Congratulations to Brandyn Whitaker as the recipient of the 2024 BRASS Student Travel Award! Brandyn is a Library Services Associate in the Workforce and Economic Development department a...
Posted on Oct 08, 2019 by Admin
Hello readers! This week’s “From the Help Desk” is short & sweet. Let’s get to it! Question: How do I analyze all of the states at once in a report? Answer: The Ranking Report allows ...