


Feature Spotlight: Custom Combination Location
Posted on Nov 03, 2017 by Admin
This week we’ll talk about one of our favorite features in SimplyAnalytics - the custom combination location. This feature is a simple and effective means to create custom geographies where you’re able to specify the exact makeup for. Let’s jump in.
Why would I want to use this feature?
Sometimes you may want to study a neighborhood in your city, or area that you know of that isn’t necessarily a formal geography itself. One of the common questions we get asked is, “How do I get data for “my neighborhood” or “downtown”?” and that’s a fair question - the problem is, “my neighborhood” or “downtown” is not a formal Census geography, but it’s probably a combination of a few CTs or ZIP Codes. That’s where the Custom Combination Location feature comes into play.
How to Use It:
In this example, we’re going to make the Greenwich Village and Soho neighborhoods in Manhattan.
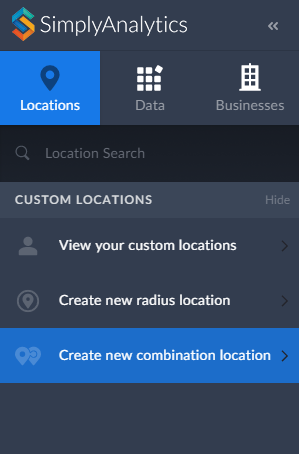
1. Click on Create New Combination Location found within the Locations tab towards the left of the screen.
2. Give your location a name.
3. Enter in the locations that comprise your target area - in this case, the Greenwich Village and Soho neighborhoods consist of ZIP Codes: 10012, 10013 and 10014.
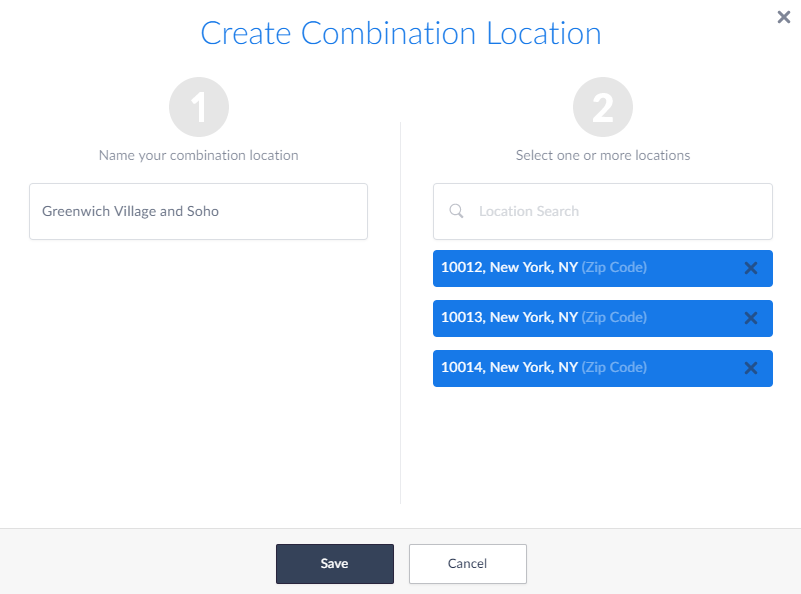
4. Select Save
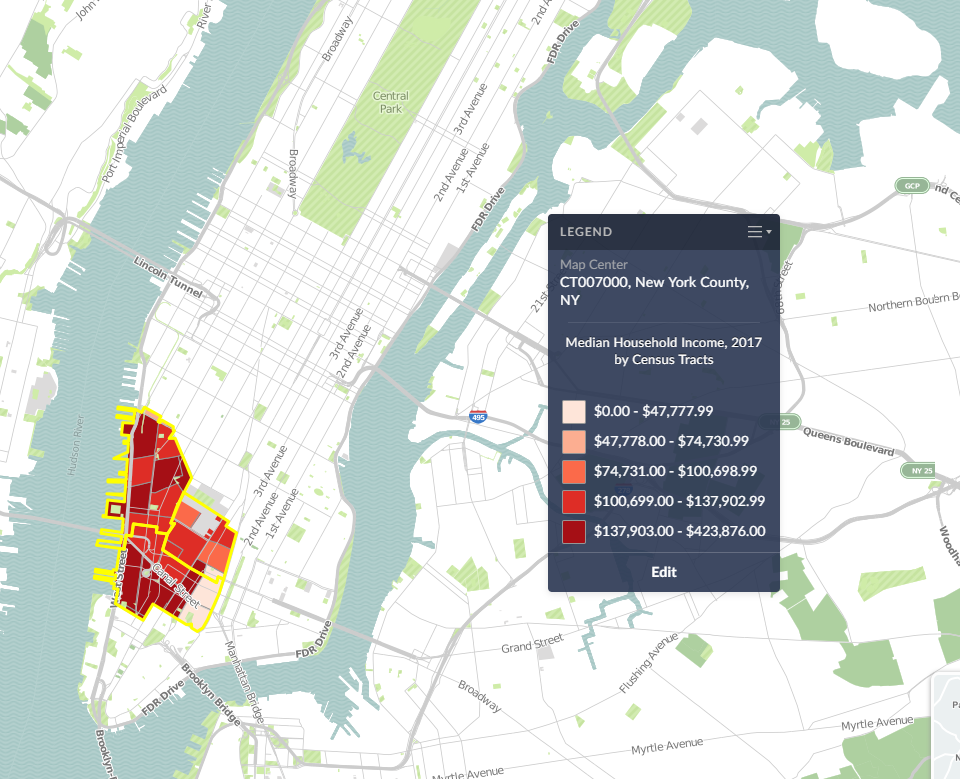
Use your Location:
Now that your custom location is saved, you are free to use it in Maps and reports. Your custom location will be stored within the View your Custom Locations option in the Locations tab.
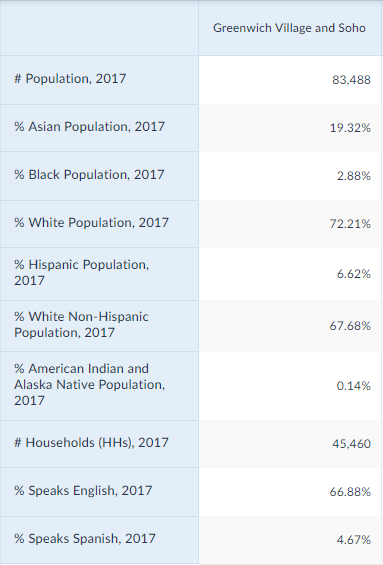
SimplyAnalytics will calculate the #, % and Average variables for you in reports:
And that’s it for today! In a future post, we’ll talk about creating combination locations from your recently used and favorite locations.
More from SimplyAnalytics
Posted on Nov 10, 2017 by Admin
Welcome to this week’s SimplyAnalytics blog post. Today we’re going to take a closer look at the options available to you when editing the map legend. Let’s get started! First, to start e...
Posted on May 26, 2016 by Admin
In this week’s report exploring SimplyMap data, we take a look at the variables available relative to internet search engines used. The source of this data will come from the SimmonsLOCAL...
Posted on Sep 03, 2015 by Admin
This week we explore the SimmonsLOCAL data package to find which cities in America have the highest percentage of residents enrolled in a frequent flyer program. SimmonsLOCAL is available...
Posted on Jun 25, 2015 by Admin
In this week’s SimplyMap report, we review the different options available when searching for a business. The easiest and fastest method of mapping businesses or creating a business repor...
Posted on Oct 30, 2018 by Admin
We are pleased to be exhibiting at this year's 30th Annual Charleston Library Conference! The Charleston Vendor Showcase will be held Tuesday, November 6, 2018, from 10:30 a.m. to 6:00 p....
Posted on Nov 23, 2012 by Admin
Men's Health magazine is charting vanity in US cities, with help from SimplyMap. What did they find? The Sunshine State, with a long history of going to great lengths to look good, tops t...
Posted on Feb 05, 2015 by Admin
In this week’s edition of exploring SimplyMap data, we take a look at America’s coffee drinkers. SimplyMap contains more than 100 coffee related variables, including consumer spending on ...
Posted on Aug 15, 2013 by Admin
Anyone who has traveled to Seattle hoping for a sunny day could fairly estimate that it is one of the rainiest states with the highest level of precipitation each year. SimmonsLOCAL varia...
Posted on Jan 28, 2010 by Admin
Come visit the Geographic Research booth at the Ontario Library Association Super Conference, February 24-27, 2010 at the Metro Toronto Convention Centre. The Ontario Library Association ...
Posted on Apr 07, 2020 by Admin
As COVID-19 spreads across the United States researchers need access to the latest data visualization and analytics tools. As a result, the SimplyAnalytics team just added COVID-19 data ...