


Exploring SimplyMap Data: America’s Coffee Drinkers
Posted on Feb 05, 2015 by Admin
In this week’s edition of exploring SimplyMap data, we take a look at America’s coffee drinkers. SimplyMap contains more than 100 coffee related variables, including consumer spending on coffee by brand and by number of coffee cups consumed per day. For this example, lets look at a broader indicator related to coffee - whether or not a household uses coffee at all. The variable, % BEVERAGES - NON-ALCOHOLIC DRINKS | GROUND OR WHOLE BEAN COFFEE | GROUND OR WHOLE BEAN COFFEE-HH USES? | YES, 2013 can be found in the SimmonsLOCAL folder. SimmonsLOCAL is a profiling system that provides insights into consumer behavior for 210 American media markets on a local level with 60,000+ data variables, including over 450 categories and 8,000 specific brands. It is a powerful resource that provides insight into consumer spending and behavior, and very popular with business students and researchers. We begin by creating a ranking report, and setting the geography to USA. Next, under the Analyze Data By drop down, select states. The results are shown below:
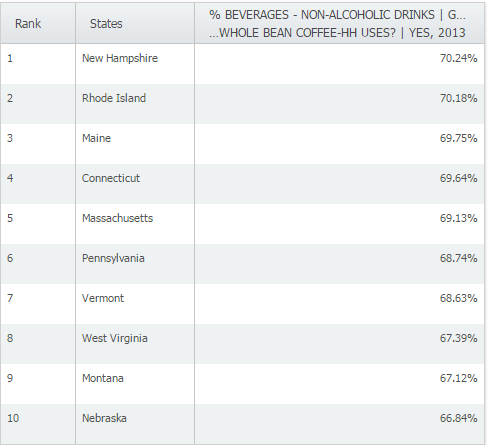 At 70.24%, New Hampshire narrowly edges out Rhode Island (70.18%) and Maine (69.75%) as the top states for household coffee drinking in the US. When we analyze by City, (by again adjusting the Analyze Data By drop down), and apply a population filter of greater than 75,000, the following cities make the top 10.
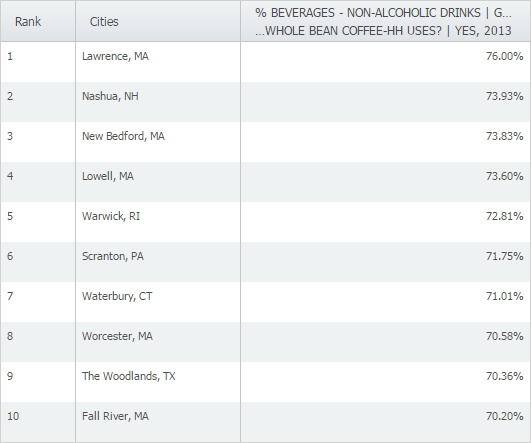 The residents of Lawrence, MA claim the top spot in the US (cities with population > 75k) for coffee drinkers at home. Lastly, we viewed the city of Lawrence by census tract.
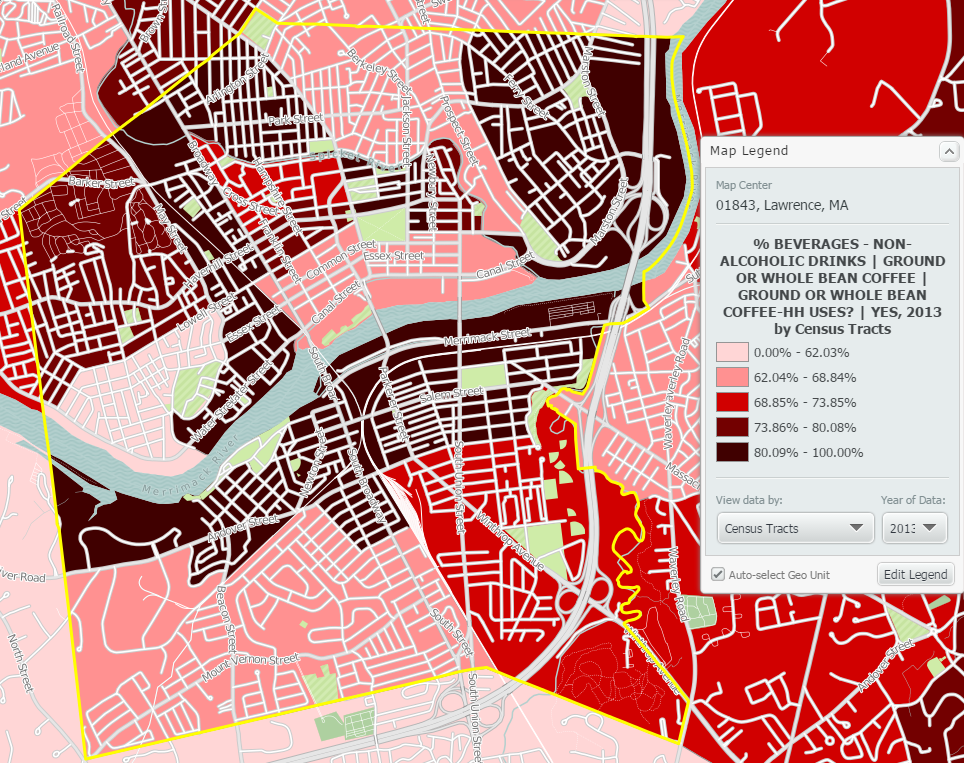 It looks like many of the residents in Lawrence, MA drink their coffee by the Merrimack River. What insights can be drawn from this? What other questions arise? Are there specific characteristics of these States, Cities, or Census Tracts that make their residents more inclined to drink coffee at home? Let us know your thoughts in the comments! Stay tuned for more SimplyMap tips and reports! Don’t forget to follow us on Twitter and like us on Facebook to stay up to date on all things SimplyMap (and score an entry to our iPad and Kindle Fire raffle while you are at it!).
More from SimplyAnalytics
Posted on Mar 13, 2023 by Admin
Hello readers! Today, we’re excited to officially introduce the Location Query Report in SimplyAnalytics. The Location Query Report is a powerful feature in SimplyAnalytics that allows us...
Posted on Sep 27, 2019 by Admin
Hello readers! This week we provide an in-depth response to a question asking about the legend classification methods in SimplyAnalytics. This response is now part of our Help Center: htt...
Posted on Jun 07, 2011 by Admin
We will be exhibiting at the Special Library Association Annual Conference in Philadelphia and the American Library Association conference in New Orleans later this month. Come and visit ...
Posted on May 10, 2016 by Admin
One benefit of data and applications like SimplyMap is the ability to visualize information. In this week’s report, we’ll take a quick look at some branding preferences in contiguous Amer...
Posted on Jan 05, 2018 by Admin
The SimplyAnalytics team is looking forward to exhibiting at the Ontario Library Association Super Conference 2018! Stop by the SimplyAnalytcs booth (115T) and take a look at our newest o...
Posted on Nov 06, 2013 by Admin
SimplyMap includes a number of helpful support tools; guided wizards available when and where you need them, detailed help files, and an online support center with FAQs and searchable kno...
Posted on Sep 14, 2021 by Admin
Welcome readers! Today we are excited to welcome histograms to SimplyAnalytics. We hope you enjoy this wonderful new visualization as much as we do. Let’s take a look. What is a histogram...
Posted on Sep 01, 2008 by Admin
The King County Library System in Washington State now subscribes to SimplyMap, and has published a brief review on their blog, Library Talk.
Posted on Dec 02, 2014 by Admin
Today we take a look at one of the more advanced features in SimplyMap - editing the map legend. Editing the map legend is a great way to not only customize how the data is distributed on...
Posted on Jan 07, 2015 by Admin
In this week’s exploration of SimplyMap data, we set out to find which cities in the United States have the highest percentage of older houses. To determine this, we used the variable “% ...