


Exploring SimplyMap Data: Internet Search Engines
Posted on May 26, 2016 by Admin
In this week’s report exploring SimplyMap data, we take a look at the variables available relative to internet search engines used. The source of this data will come from the SimmonsLOCAL data set which, as we’ve mentioned before, contains over 60,000 data variables. With that much data available, it’s safe to say that this series will be around for a very long time. Let’s get started!
Our general assumption here is that Google is the most used search engine in the United States. But does the data backup our assumption? Let’s find out.
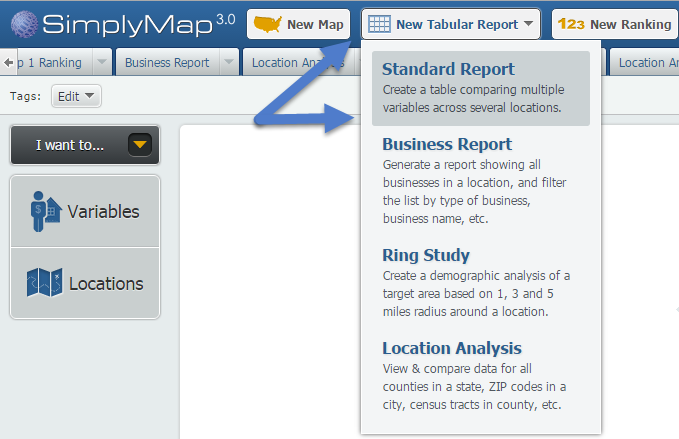
First, create a new Standard Report under the New Tabular Report button:
Next, open the Variables panel and navigate through the following path to find the variables of interest: SimmonsLOCAL » INTERNET » SEARCH ENGINES(COMPUTERS & OTHR DEVICES) » SEARCH ENGINES - HOW USED » SEARCH ENGINE I CURRENTLY USE MOST OFTEN.
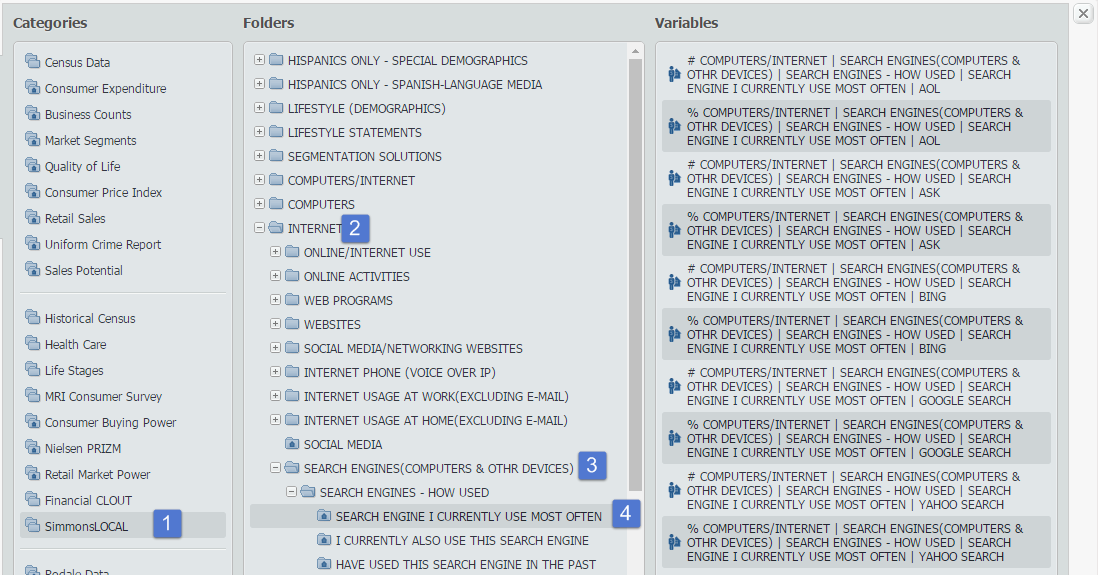
In total, there are four folders that contain search engine data, broken down by:
1. Search Engine I Currently Use Most Often
2. I Currently Also Use This Search Engine
3. Have Used This Search Engine in the Past
4. I Have Never Used this Search Engine
Each folder contains data on five search engines:
1. AOL
2. Ask
3. Bing
4. Google
5. Yahoo
As the path above indicates, we’ll be focusing on the first folder - Search Engine I Currently Use Most Often. Once you have selected the associated percent variables for the 5 search engines, close out your report to compile the data for the United States. Results below!
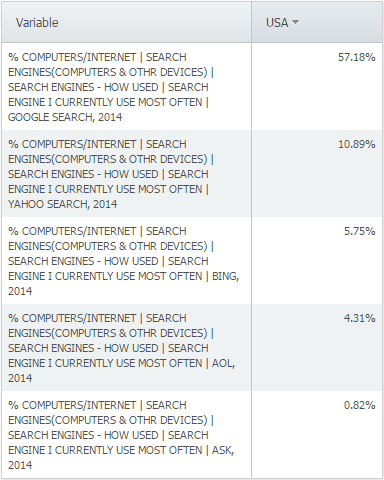
Our assumption was proven correct by the data, although the disparity between the search engines was surprising, with Google being the overwhelming favorite here in the United States.
Last week we posted a map challenging readers to guess what the map was portraying. The correct answer? Average Annual Snowfall (Total Inches)! If you guessed correctly, good job. If not, stay tuned for more!
More from SimplyAnalytics
Posted on Oct 24, 2019 by Admin
Hi everybody! This week we wanted to bring you something unique, so we’re taking you behind the scenes to show you what goes in to setting up the SimplyAnalytics conference booth you’ve c...
Posted on Nov 23, 2012 by Admin
Men's Health magazine is charting vanity in US cities, with help from SimplyMap. What did they find? The Sunshine State, with a long history of going to great lengths to look good, tops t...
Posted on Feb 02, 2024 by Admin
We are excited to be back exhibiting at PLA this April in Columbus, OH. Join us at Booth #2631 to discover how SimplyAnalytics can help libraries understand their service area, assist sma...
Posted on Jun 27, 2009 by Admin
The library faculty at Regent University in Virginia recently spotlighted SimplyMap in their Library Faculty Recommendations blog, highlighting its powerful ability to create professional...
Posted on Dec 08, 2017 by Admin
Good afternoon, readers! This week we’re going to talk about project management in SimplyAnalytics and how to best take advantage of it. Why are projects needed? Many users have multiple...
Posted on Mar 21, 2018 by Admin
The Quick Report is one of the newest features added to SimplyAnalytics - let’s take a look at how it can support your research. This report instantly provides you with a curated list of ...
Posted on Apr 17, 2009 by Admin
The Special Libraries Association will hold its Annual Conference in Washington, DC at the Washington Walter E. Washington Convention Center from June 14-17 2009. The conference will crea...
Posted on Sep 07, 2011 by Admin
Geographic Research will be exhibiting and presenting during a vendor showcase session at the upcoming North Carolina Library Association (NCLA) Biennial Conference, October 4-7, 2011 in ...
Posted on Sep 18, 2015 by Admin
With tens of thousands of variables available in SimplyMap, it’s common for users to wonder whether or not a particular variable they have in mind is available in SimplyMap. This is where...
Posted on Feb 25, 2020 by Admin
SimplyAnalytics will be exhibiting at the PLA Conference, held this year at the Music City Center in Nashville, TN on February 26 - 28. Visit the team at Booth 1444 with your questions, f...