


Using Multiple Filter Conditions
Posted on Apr 14, 2016 by Admin
This week’s SimplyMap report will provide an overview of one of the more advanced functionalities in SimplyMap - applying multiple filter conditions. Filters can be applied to any map or report tabs. For example, a map showing Household income levels by ZIP Code could be filtered to only show ZIP Codes with income over a specific threshold. Another example would be to filter the same income map to only show ZIP Codes with a population over 8,000. Using multiple filter conditions is a great way to hone your focus on a narrower set of geographic locations that meet your multiple criteria. Let’s get started with an example.
Scenario: You are looking for the best location to open up a high end salon in California and want to develop an initial list to further analyze. Let’s assume there are three criteria that must be met before considering a location.
1. The location has to have more than 500,000 residents.
2. The location must have a median household income of at least 75,000.
3. At least 30% of households must report spending money at a salon.
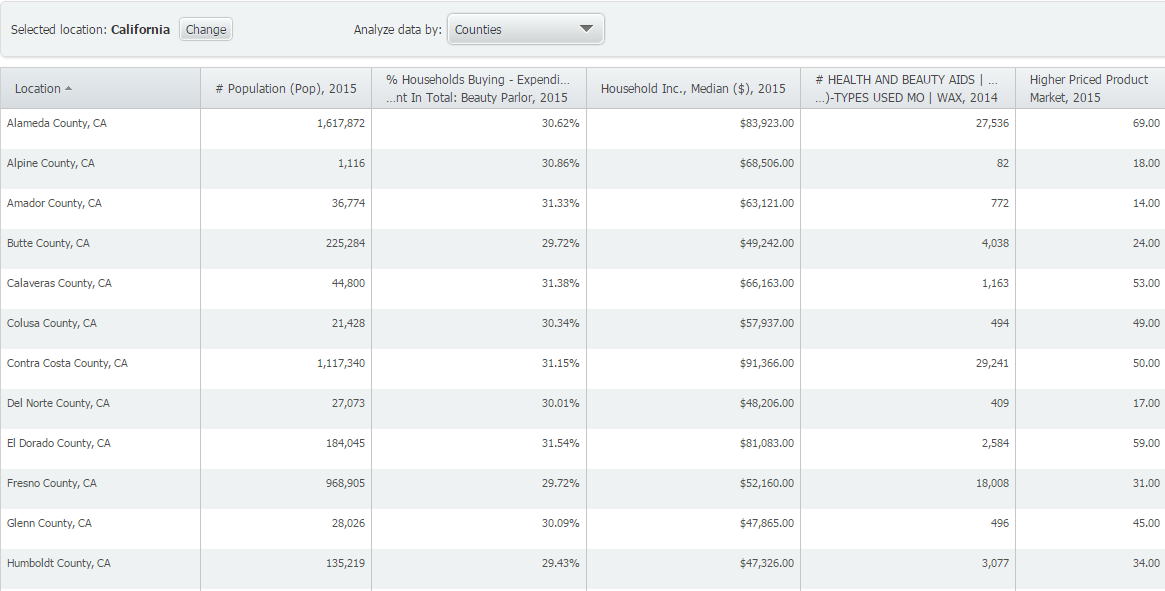
The Setup: First, create a new Location Analysis Report and set your location to California. Next, navigate through some pertinent variables and add the following variables that will serve as our criteria.
# Population, Total (Census Data » People and Households » Age » Total)
Household Inc., Median (Census Data » People and Households » Income » HH Income)
% Households Buying - Expenditures: Amount Spent In Total: Beauty Parlor (MRI Consumer Survey » Purchasing » Average HH Spending)
After you have added all variables you are interested in, close out the Variables panel to generate your report. Results below:
Your initial results will display all counties in California. To create a filter, click on Data Filters > Create New Filter from the top right of SimplyMap. The filter creation dialog will open up.
NOTE: The only variables that will show up as possible filter criteria in the variable dropdown will be either recently used variables, or favorite variables. In this case, we have the variables already in the report, so by default they will show under recently used variables.
1. Select the first dropdown and click on the beauty parlor variable. Leave the second dropdown to “is greater than” and enter a value of 30 in the last box.
2. Click on Add Another Condition to bring up a second variable selection box - choose the population variable and set that to “is greater than” 500,000.
3. Lastly, click on Add Another Condition once more, and find the Median Household Income variable - set this value to “is greater than” 75,000.
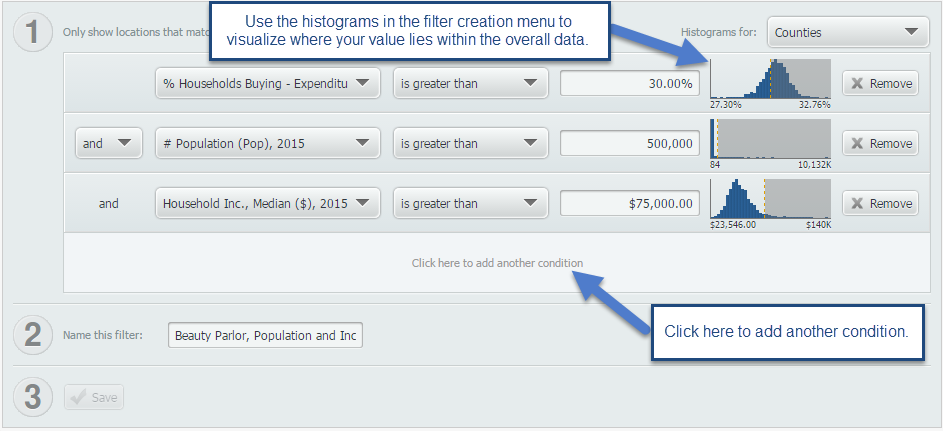
Give your filter a name, and click on SAVE to apply it onto your report. New results below!
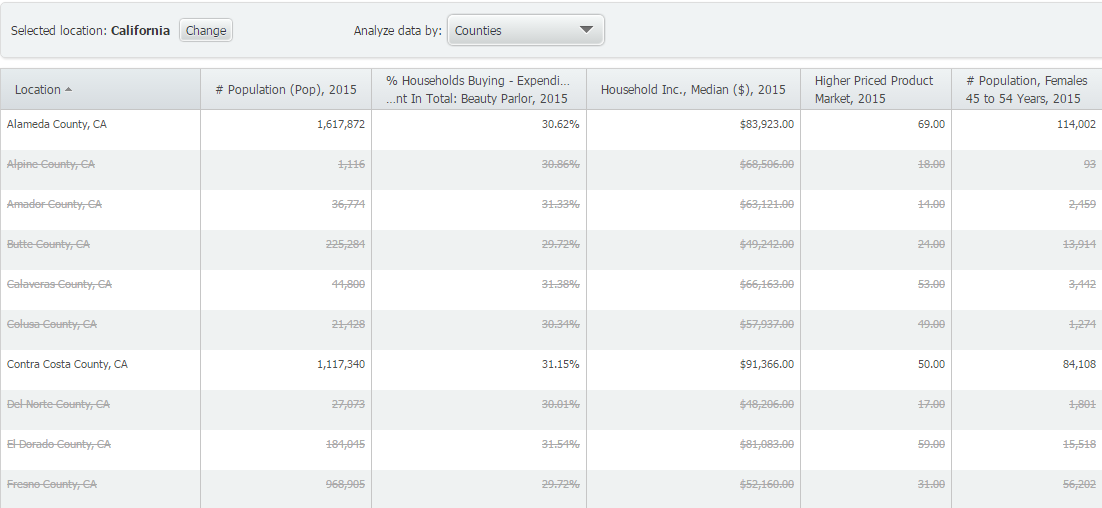
Locations that do not meet your three conditions are then struck out with a line and seen in light gray. If you’d like to hide these locations, click on Display Options > Filtered Locations > Hide. Your final report is shown below:
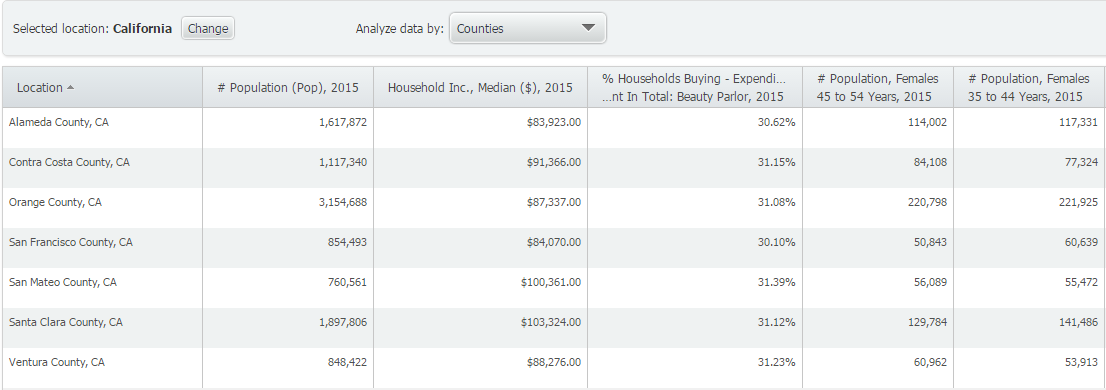
Only 7 of California’s 58 counties meet our specific criteria.
A logical next step for someone doing market research would be to analyze specific ZIP Codes or census tracts within these counties more in depth, and run business reports to see what the competition is like in the target areas.
Do you have any questions on creating and applying filters? Feel free to leave a comment below or send as an email at: support@geographicresearch.com
More from SimplyAnalytics
Posted on Jan 28, 2010 by Admin
Come visit the Geographic Research booth at the Ontario Library Association Super Conference, February 24-27, 2010 at the Metro Toronto Convention Centre. The Ontario Library Association ...
Posted on Jun 21, 2022 by Admin
Hello readers! We hope you’re having a great day. Today we are featuring 5 commonly asked questions about the American Community Survey dataset that’s available to all customers in Simply...
Posted on Aug 27, 2018 by Admin
Welcome readers! This week we are excited to feature our newest view in SimplyAnalytics, the Time Series Table.What is it?The Time Series Table allows you to quickly pull all years availa...
Posted on Nov 22, 2016 by Admin
We will be exhibiting at ALA Midwinter in Atlanta, Georgia in January. You can find the GRI team at Booth 1155, where we will be catching up with customers old and new, and sharing some e...
Posted on Jul 30, 2015 by Admin
One great feature within SimplyMap is the ability to track the same variable across multiple years. In this report, we will track the percentage of households in the US ordering items fro...
Posted on Nov 06, 2013 by Admin
SimplyMap includes a number of helpful support tools; guided wizards available when and where you need them, detailed help files, and an online support center with FAQs and searchable kno...
Posted on Oct 02, 2015 by Admin
In this week’s SimplyMap tip, we wanted to do a quick write up reminding users about the Saved Tabs feature within SimplyMap. Did you know that SimplyMap will automatically save all of yo...
Posted on Dec 02, 2019 by Admin
Hi everybody! We’re back this week with another question from our Help Desk. This time featuring SimplyAnalytics Canada. Let’s get started! Question: How can I analyze all of the PRIZM5 s...
Posted on Sep 08, 2016 by Admin
One of our favorite uses of SimplyMap is to find data that validates our general assumptions and observations. For example, in a previous blog we wrote about the growth of tablet ownershi...
Posted on Mar 30, 2016 by Admin
In previous blog entries we highlighted the usefulness of viewing multiple years of data for the same variable. In short, analyzing the same variable across multiple years allows users to...