


American Community Survey Data in SimplyAnalytics
Posted on Jun 21, 2022 by Admin
Hello readers! We hope you’re having a great day. Today we are featuring 5 commonly asked questions about the American Community Survey dataset that’s available to all customers in SimplyAnalytics. Let’s get started.
What is the American Community Survey?
The American Community Survey (ACS) is an ongoing monthly/annual survey of over 3.5 million households in the US conducted by the U.S. Census Bureau. The ACS asks questions about topics such as education, employment, internet access, transportation, disability and more. These topics and the reported answers are useful to understand communities, and to help determine funding/programming needs. Here’s a wonderful explanation of why the ACS asks about each of these topics: https://www.census.gov/acs/www/about/why-we-ask-each-question/
What Years are Available in SimplyAnalytics?
Every SimplyAnalytics user has access to the following years of ACS data: 2010, 2011, 2012, 2013, 2014, 2015, 2016, 2017, 2018, 2019, 2020 (estimate), 2021 (estimate), 2025 (projection), 2026 (projection).
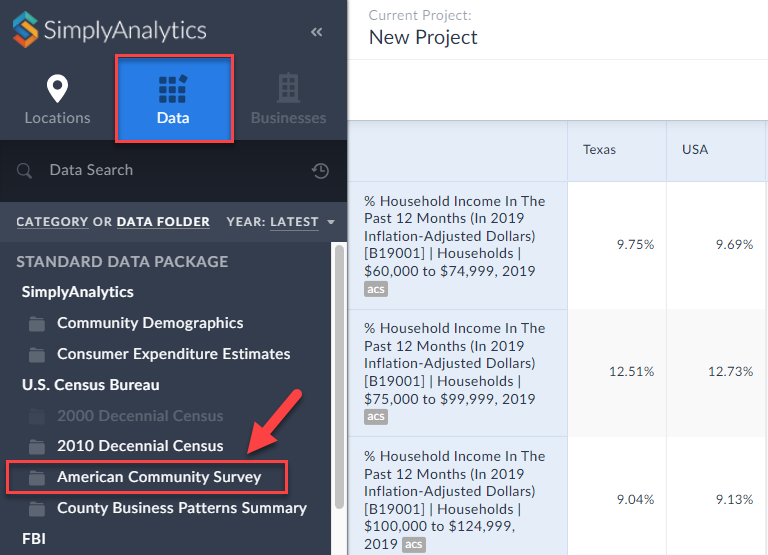
How can I access the ACS data in SimplyAnalytics?
You can jump directly to the ACS data folder by clicking on Browse by Data Folder from within the Data block at the top left of SimplyAnalytics.
 What type of data is available in the ACS?
Each year of the ACS includes thousands of data variables for users to choose from. Below is a list of the main topics - note that many of the folders below contain multiple subfolders.
What type of data is available in the ACS?
Each year of the ACS includes thousands of data variables for users to choose from. Below is a list of the main topics - note that many of the folders below contain multiple subfolders.
What type of data is available in the ACS?
Each year of the ACS includes thousands of data variables for users to choose from. Below is a list of the main topics - note that many of the folders below contain multiple subfolders.
- Age; Sex
- Race
- Hispanic or Latino Origin
- Ancestry
- Citizenship Status; Year of Entry; Foreign Born Place of Birth
- Place of Birth
- Migration/Residence 1 Year Ago
- Commuting (Journey to Work); Place of Work
- Relationship to Householder
- Grandparents and Grandchildren Characteristics
- Household Type; Family Type; Subfamilies
- Marital Status; Marital History
- Fertility
- School Enrollment
- Educational Attainment; Undergraduate Field of Degree
- Language Spoken at Home
- Poverty Status
- Disability Status
- Income
- Earnings
- Veteran Status; Period of Military Service
- Food Stamps/Supplemental Nutrition Assistance Program (SNAP)
- Employment Status; Work Status Last Year
- Industry, Occupation, and Class of Worker
- Housing Characteristics
- Group Quarters
- Health Insurance Coverage
- Computer and Internet Use
- Citizen Voting-Age Population
- Quality Measures
- Allocation Table for Any Subject
- Map View: Create a map of a city, and visualize the Census Tracts by % of households that have moved in within the past year from a different state
- Ranking Report: Rank the ZIP Codes in a state with the highest % of households who do not have a computer
- Comparison Report: Research disability data in your home Census Tract, and compare that data with the ZIP Code, County, State, and US.
More from SimplyAnalytics
Posted on Feb 23, 2012 by Admin
Geographic Research, Inc. will be exhibiting at the Public Library Association (PLA) Conference. Visit us at Booth 2329 to learn more about SimplyMap and enter our raffle for a new com...
Posted on Mar 18, 2015 by Admin
Can you guess which US city has the most residents per square mile? Today we’re going to use SimplyMap to answer this question for all cities, as well as cities with a population greater ...
Posted on Jan 12, 2020 by Admin
Happy New Year! SimplyAnalytics will be exhibiting at the ALA Midwinter meeting, held this year at the Pennsylvania Convention Center in Philadelphia on January 24th-27th. If you attend, ...
Posted on May 10, 2016 by Admin
One benefit of data and applications like SimplyMap is the ability to visualize information. In this week’s report, we’ll take a quick look at some branding preferences in contiguous Amer...
Posted on Oct 07, 2013 by Admin
Do you know the quickest way to find the name of a Block Group, Census Tract or ZIP code in our upcoming release for 3.0? The i-Tool gives you the ability to click anywhere on a map to g...
Posted on Feb 24, 2023 by Admin
We are excited to attend SCELCapalooza 2023, a three-day conference for academic and research librarians in Southern California. The Vendor Day showcase will take place on March 1st, 2023...
Posted on May 24, 2023 by Admin
SimplyAnalytics is excited to attend. Swing by booth 1733 for a brief demo, and discover how our user-friendly demographics, business, health & marketing data analytics and visualizat...
Posted on Dec 19, 2016 by Admin
Stop by the Geographic Research booth [#T8] at the Ontario Library Association Super Conference to get a hands-on look at our latest and greatest SimplyMap offering. The conference will t...
Posted on Dec 12, 2011 by Admin
Men's Health magazine has published a ranked list to help readers find the cities where Americans are the saddest and where they are living with big smiles on their faces. As they note, "...
Posted on May 08, 2018 by Admin
This summer's ALA conference is in New Orleans and the SimplyAnalytics team will be exhibiting at booth #837. We hope you stop by to learn about new features, check out our new data offer...