


The Location Query Report
Posted on Mar 13, 2023 by Admin
Hello readers! Today, we’re excited to officially introduce the Location Query Report in SimplyAnalytics. The Location Query Report is a powerful feature in SimplyAnalytics that allows users to quickly and easily identify target locations. This report is especially useful for businesses, researchers, and marketers who are looking to find some locations based on their desired conditions. Think of this report as a reimagining of the data filters, where we’ve put that functionality into a report and made it easier to understand what you are viewing. Let’s take a look at an example.
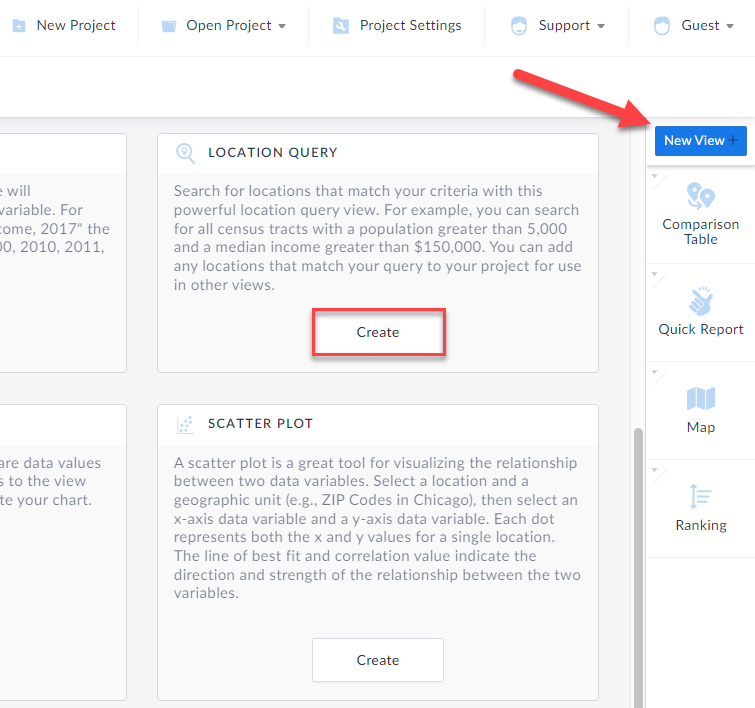
How to Create this Report:In your project, click on New View > “Create” Under the Location Query report
The Location Query report appears. Some tips in the image below of the layout:
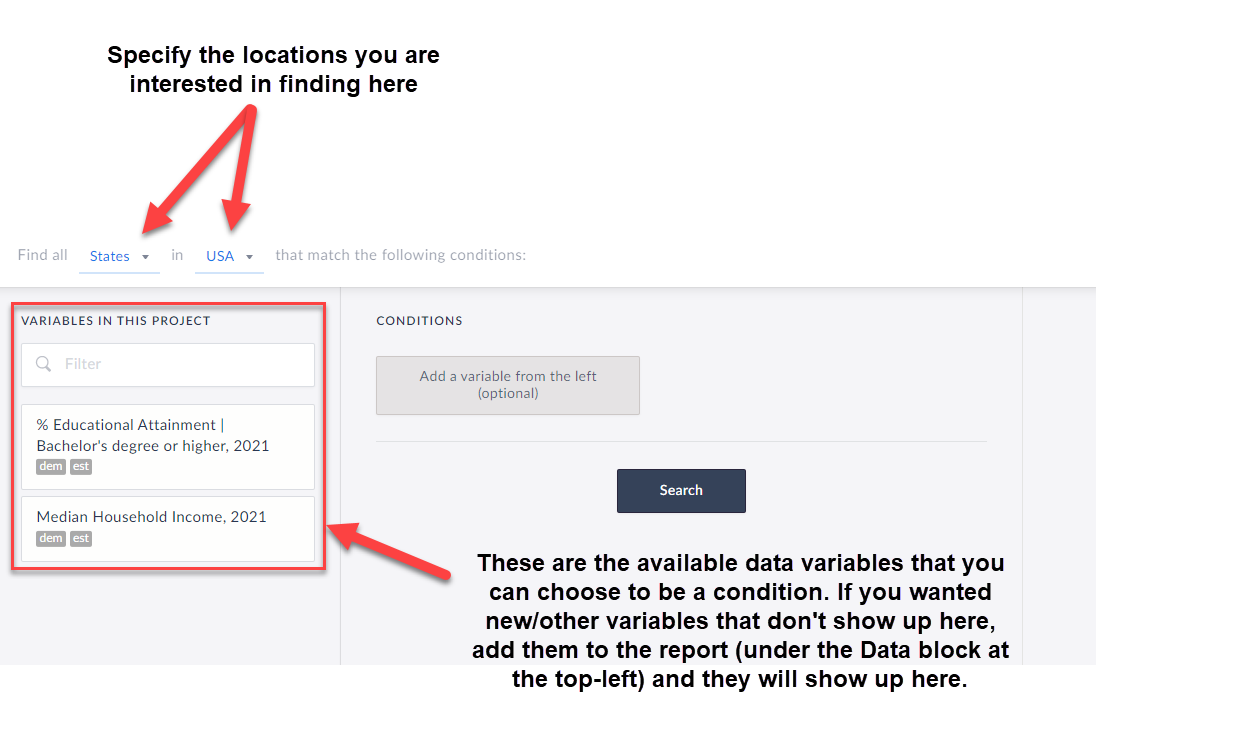
To begin the query, first choose from the dropdown at the top that reads: Find all X in Y that match the following conditions. This is where to choose which locations you are looking for. For example, find all ZIP Codes in Colorado, or all Census Tracts in Miami-Dade County, etc.
Next, add in variables by clicking on them and specify the conditions you are looking for. TIP: Any data variable in SimplyAnalytics can be a condition, and you are welcome to have dozens of conditions, so feel free to be as creative or as specific as you want!
Click Search, and voila! The far-right side of the workspace will display which locations meet your criteria. Check out the report we created below:
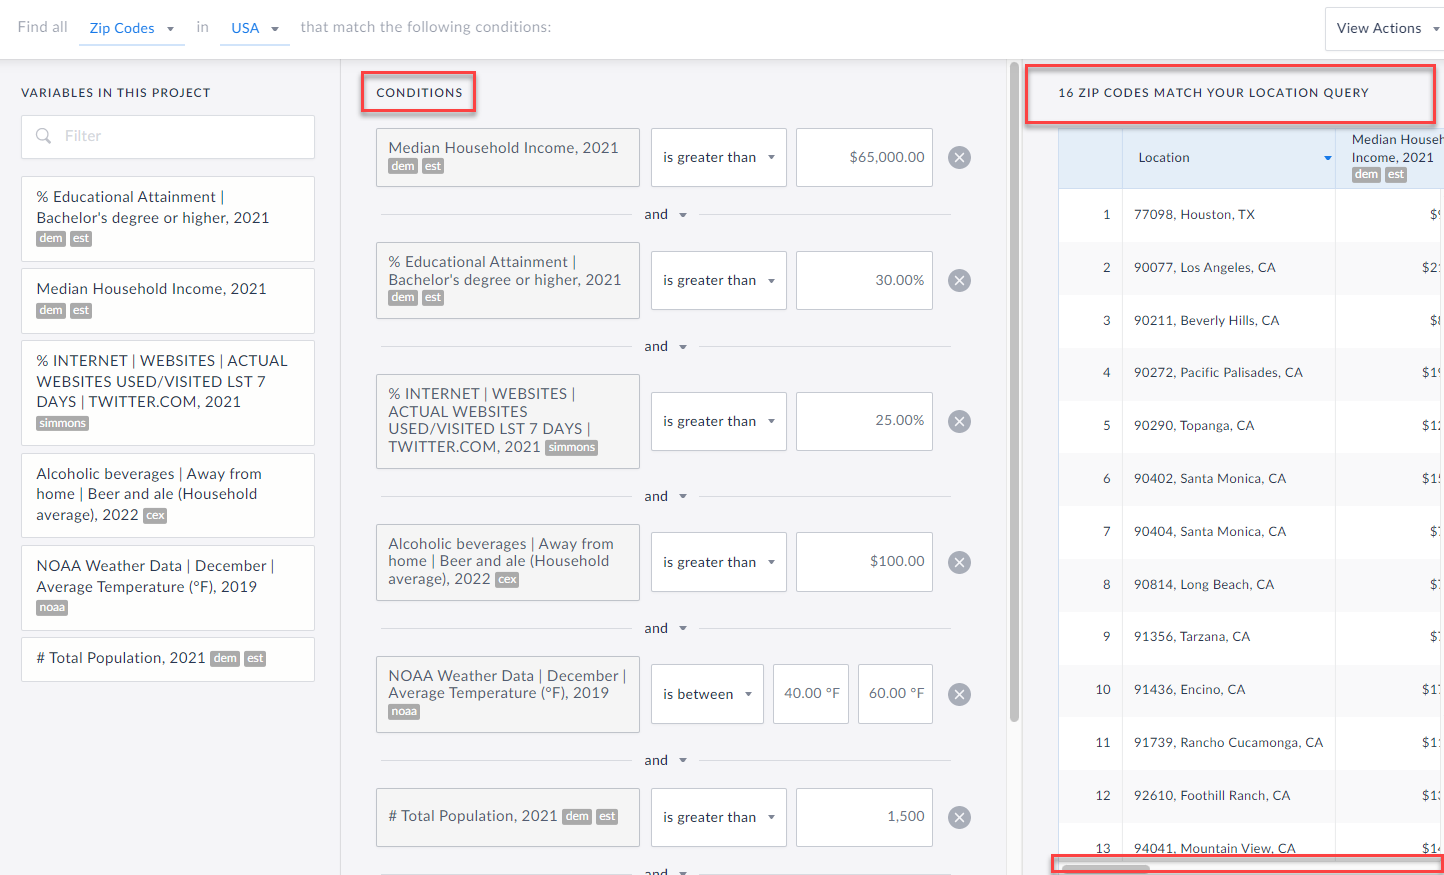 So, in case you were wondering - there are 16 ZIP Codes in the USA that:
Have a Median HH Income greater than $65,000
AND
The % of Adults 25+ with a Bachelor’s degree or higher is greater than 30%
AND
The % of adults who have been on Twitter in the past week is greater than 25%
AND
The Average HH spends more than $100 on Beer and Ale away from Home
AND
The Average Temperature in December is between 40 and 60 degrees
AND
The Zip Codes have a population of more than 1,500
This is sort of a silly example, but it does highlight what you are capable of doing with this report in SimplyAnalytics. Let us know any interesting queries you come up with!
More from SimplyAnalytics
Posted on Jul 24, 2013 by Admin
Registration is now open for the North Carolina Library Association Conference! Visit us at the 60th biennial conference (Booth #45) through October 15 - 18, 2013. We have beautiful ca...
Posted on Jun 02, 2016 by Admin
Three weeks ago we utilized the SimmonsLOCAL data set to visualize contiguous America’s mayonnaise brand preference. Staying with the American visualization theme, this week’s report will...
Posted on Feb 13, 2015 by Admin
In this week’s report exploring SimplyMap data, we want to find out where America’s remote workers reside. To find this, we can tap into the Census data in SimplyMap. The specific variabl...
Posted on Mar 04, 2014 by Admin
March 11-15 Indianapolis, Indiana The Public Library Association is prepared for another week of events, workshops and special appearances for librarians and authors. Visit our exh...
Posted on Jun 08, 2015 by Admin
In this week’s report we take a look at one folder found within SimplyMap’s SimmonsLOCAL data package. SimmonsLOCAL is a powerful targeting and profiling system that provides insights int...
Posted on May 31, 2011 by Admin
Kenneth Johnson of the Science, Industry, and Business Library at the New York Public Library recently provided a "boot camp" on the library's market research resources to budding entrep...
Posted on Apr 17, 2009 by Admin
The Special Libraries Association will hold its Annual Conference in Washington, DC at the Washington Walter E. Washington Convention Center from June 14-17 2009. The conference will crea...
Posted on Jan 24, 2009 by Admin
Men's Health magazine took a look this month at where our wireless habits are most out of control. Their methodology includes the use of SimplyMap: First, we crunched data from SimplyMap...
Posted on Oct 24, 2019 by Admin
Hi everybody! This week we wanted to bring you something unique, so we’re taking you behind the scenes to show you what goes in to setting up the SimplyAnalytics conference booth you’ve c...
Posted on Apr 14, 2016 by Admin
This week’s SimplyMap report will provide an overview of one of the more advanced functionalities in SimplyMap - applying multiple filter conditions. Filters can be applied to any map or ...