


SimplyMap Tip: Using Multiple Years
Posted on Jul 30, 2015 by Admin
One great feature within SimplyMap is the ability to track the same variable across multiple years. In this report, we will track the percentage of households in the US ordering items from Amazon.com, as we suspect it might show a marked increase over the span of the available years. The value in viewing the same variable over multiple years is that it helps users identify trends in the data over time.
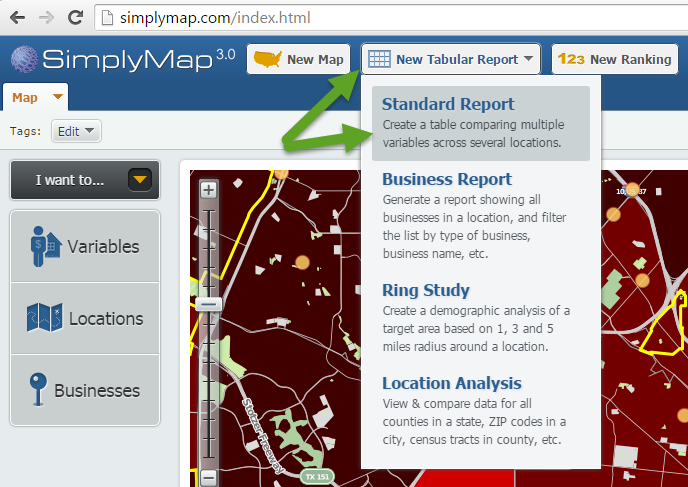
Let’s get started. First, create a Standard Report by selecting New Tabular Report > Standard Report at the top of your screen.
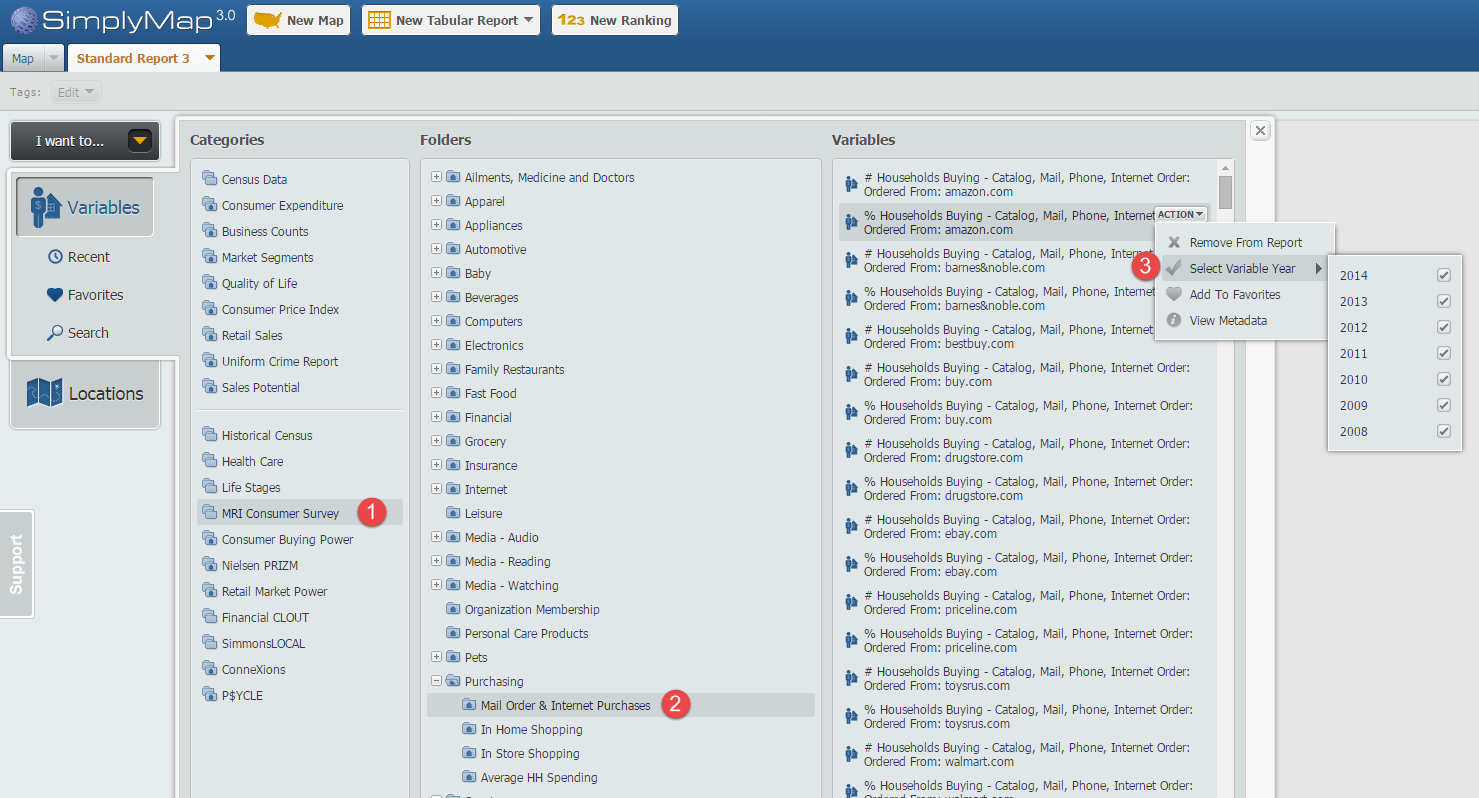
Next, navigate through this path: MRI Consumer Survey » Purchasing » Mail Order & Internet Purchases and hover over the variable, % Households Buying - Catalog, Mail, Phone, Internet Order: Ordered From: amazon.com, 2014 so the actions menu appears. From the “Select Variable Year” option check off the list of years you would like to see. In this example we will use 2008-2014. See the image below for reference:
Close out the variables panel, and your Standard Report will be created using the United States by default. Results below!
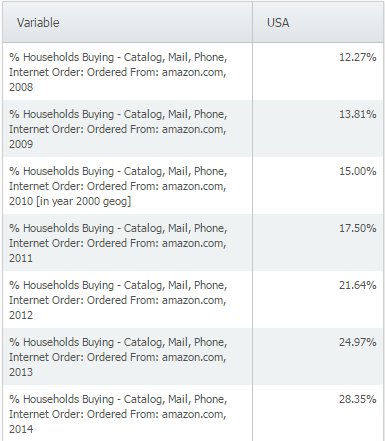
The data clearly shows a trend in Amazon.com ordering throughout years, more than doubling from 2008 to 2014 nationally. We suspected this at the onset, and the data appears to back up our initial thoughts. Feel free to add any additional geographies you’d like to see - the data is available down to the block group level.
There are over 200 variables available within the Mail Order & Internet Purchases folder in the MRI Consumer Survey data, including other websites such as:
ebay.com
buy.com
priceline.com
bestbuy.com
walmart.com
And purchases by catalog/mail order from:
QVC
L.L. Bean
Macy’s
Nordstrom
We encourage you to explore the many variables found within the MRI data package. If your school or library does not currently subscribe to the MRI data set, please write in to support@geographicresearch.com. We are always happy to provide demonstrations and trials of data packages at no cost.
What other trends have you utilized SimplyMap to identify? Let us know in the comments below!
More from SimplyAnalytics
Posted on Oct 27, 2017 by Admin
Welcome to our first ever SimplyAnalytics blog! Every Friday we’ll post a write up on a specific feature or highlight some interesting data in SimplyAnalytics. The goal of these posts is ...
Posted on Mar 03, 2016 by Admin
In this week’s SimplyMap report we take a look into the SimmonsLOCAL dataset to determine which cities in America have the highest percentage of residents who consume organic food product...
Posted on Jun 21, 2019 by Admin
Come visit the SimplyAnalytics booth (#3010) at the upcoming ALA 2019 show in Washington, D.C.! Our team will be on hand offering quick demos of SimplyAnalytics, answering questions and s...
Posted on Apr 05, 2019 by Admin
Come visit the SimplyAnalytics booth (325) at the upcoming ACRL 2019 show in Cleveland! Say hello, grab a chocolate, and stay for a quick demo of SimplyAnalytics. The team will be showcas...
Posted on Nov 20, 2015 by Admin
In a previous blog we demonstrated the power of utilizing multiple years for the same variable. We found that the usage of Amazon.com had grown substationally from 2008-2014. In this week...
Posted on Oct 08, 2008 by Admin
Geographic Research, Inc. (GRI) is pleased to sponsor the fourth annual American Collegiate Retailing Association’s Undergraduate Student Retail Analysis Competition. This is the second ...
Posted on Nov 04, 2013 by Admin
SimplyMap 3.0 is here, and uses the latest technology to provide better performance, improved reliability, and powerful new features. There are many improvements designed to make it easie...
Posted on Aug 26, 2015 by Admin
Most people in the United States could probably guess which cities are popular amongst tourists - Los Angeles and New York. But can you guess how much money is spent in novelty and souven...
Posted on Oct 24, 2019 by Admin
Hi everybody! This week we wanted to bring you something unique, so we’re taking you behind the scenes to show you what goes in to setting up the SimplyAnalytics conference booth you’ve c...
Posted on Oct 26, 2016 by Admin
In this week’s SimplyMap report, we’ll take a look at the tags feature and demonstrate how it can be useful for you as you work in SimplyMap. SimplyMap users can have up to 20 tabs open i...