


Exploring SimplyMap Data - Median Rent
Posted on Jan 29, 2016 by Admin
In a previous blog entry, we highlighted the benefits of having multiple years of data available for the same variable. This allows users to identify trends over time. Keeping with the same theme, this week we’ll take a look at how the median rent has changed between 2000, 2010 and 2015.
Let’s take a quick look at the US and move on to some cities we suspect may show a marked increase.
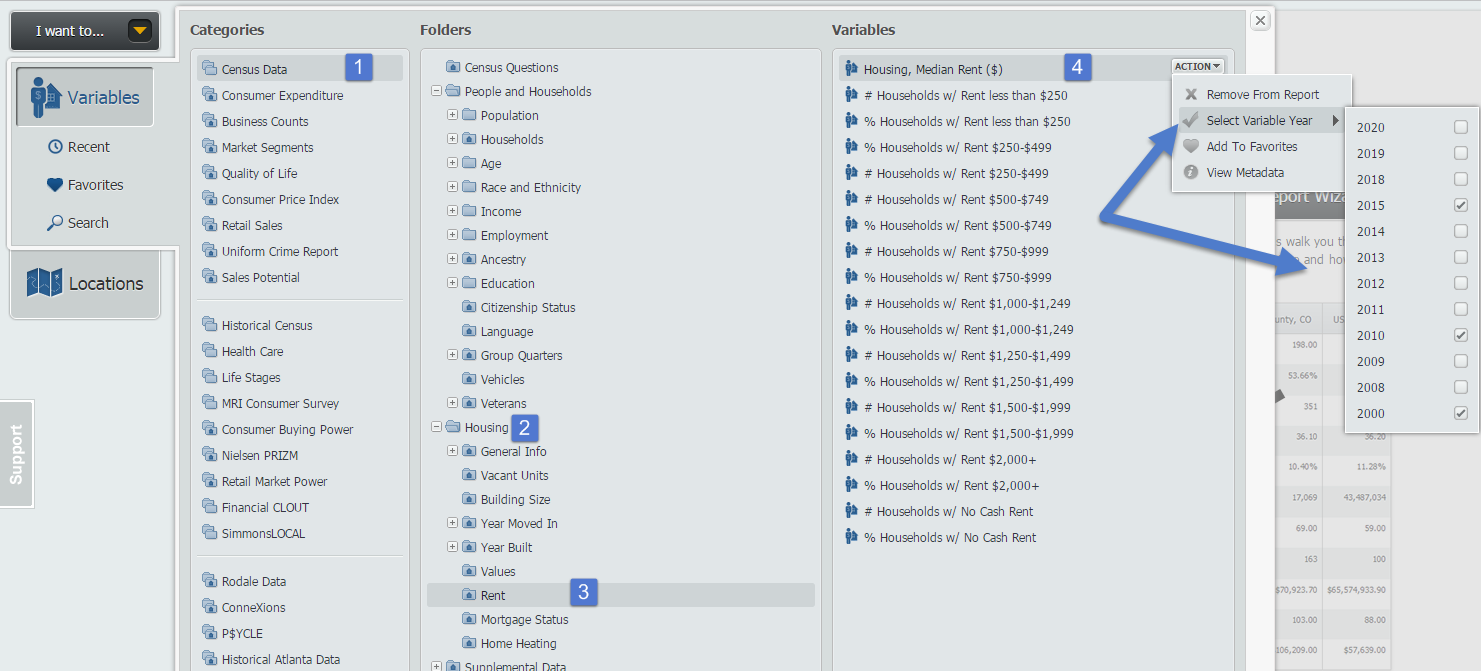
First, create a Standard Report and navigate through the median rent variable at this path: Census Data » Housing » Rent.
Next, hover over the variable and use the Select Variable Year option to select the years 2000, 2010 and 2015. Picture below for reference.
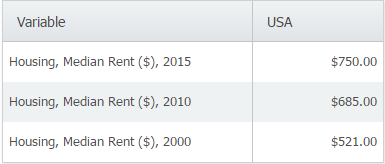
Close out the variables panel, and the report will generate:
To see how some other cities compare in their changes over time, return to the Locations menu to add your new locations. Here’s a report showing the median rents over time for: San Francisco, New York, Seattle, Chicago, Denver and San Antonio.
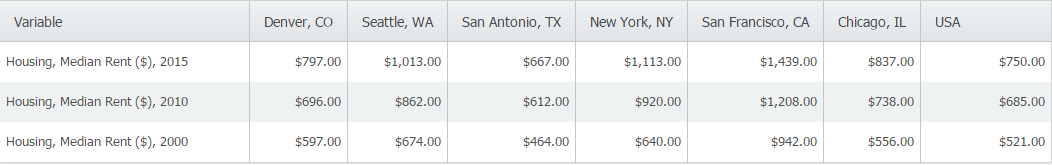
Key Takeaways from the Data:
- San Francisco’s median rent is almost double the median for the United States.
- San Antonio’s median rent is well below many other comparatively large markets.
We hope you enjoyed this week’s SimplyMap report. Stay tuned for more!
More from SimplyAnalytics
Posted on Mar 04, 2014 by Admin
March 11-15 Indianapolis, Indiana The Public Library Association is prepared for another week of events, workshops and special appearances for librarians and authors. Visit our exh...
Posted on Jan 16, 2026 by Admin
We are excited to be exhibiting at the Public Library Association (PLA) 2026 Conference in Minneapolis this April 1-3!
Posted on Oct 16, 2015 by Admin
Did you know that SimplyMap includes the ability to export Shapefile data for use in desktop mapping software (such as MapInfo or ArcGIS)? This advanced feature extends the power of Simpl...
Posted on Mar 09, 2010 by Admin
The GRI team will be exhibiting at the 2010 Public Library Association conference later this month at the Oregon Convention Center in Portland, OR. The PLA National Conference is the prem...
Posted on Nov 06, 2019 by Admin
Hello readers! We hope you’re having a wonderful week. Today we feature another entry from our From the Help Desk series. Let’s get started! Question: How do I analyze data for downtown? ...
Posted on Mar 02, 2018 by Admin
In this week’s blog we’ll take a look at how to enter an address in SimplyAnalytics to find the Census Block Group or Census Tract. Let’s get started! Use Case: You want to analyze the ar...
Posted on May 26, 2020 by Admin
Hello readers! We hope you are doing well, and thank you for your continued support of SimplyAnalytics. We are excited to announce that scatterplots are officially live! Scatter plots ar...
Posted on Jul 30, 2015 by Admin
One great feature within SimplyMap is the ability to track the same variable across multiple years. In this report, we will track the percentage of households in the US ordering items fro...
Posted on Feb 01, 2009 by Admin
Want to know the top 10 wealthiest ZIP codes in your state? How about the top 25 counties with the most elderly residents? Duke University students can now easily answer these questions a...
Posted on Mar 30, 2016 by Admin
In previous blog entries we highlighted the usefulness of viewing multiple years of data for the same variable. In short, analyzing the same variable across multiple years allows users to...