


From the Help Desk: How do I analyze data for downtown?
Posted on Nov 06, 2019 by Admin
Hello readers! We hope you’re having a wonderful week. Today we feature another entry from our From the Help Desk series. Let’s get started!
Question: How do I analyze data for downtown?
Answer: Use the combination location feature. The combination location feature enables users to combine locations of similar geographies to form one larger area. SimplyAnalytics will calculate all number, percent, and average data variables for the custom area. Here’s how to do that.
- Click on the Locations button (1), and select the Custom Locations heading (2). From there, select Create New Combination Location (3). Enter the name for your location in box 1 (4).
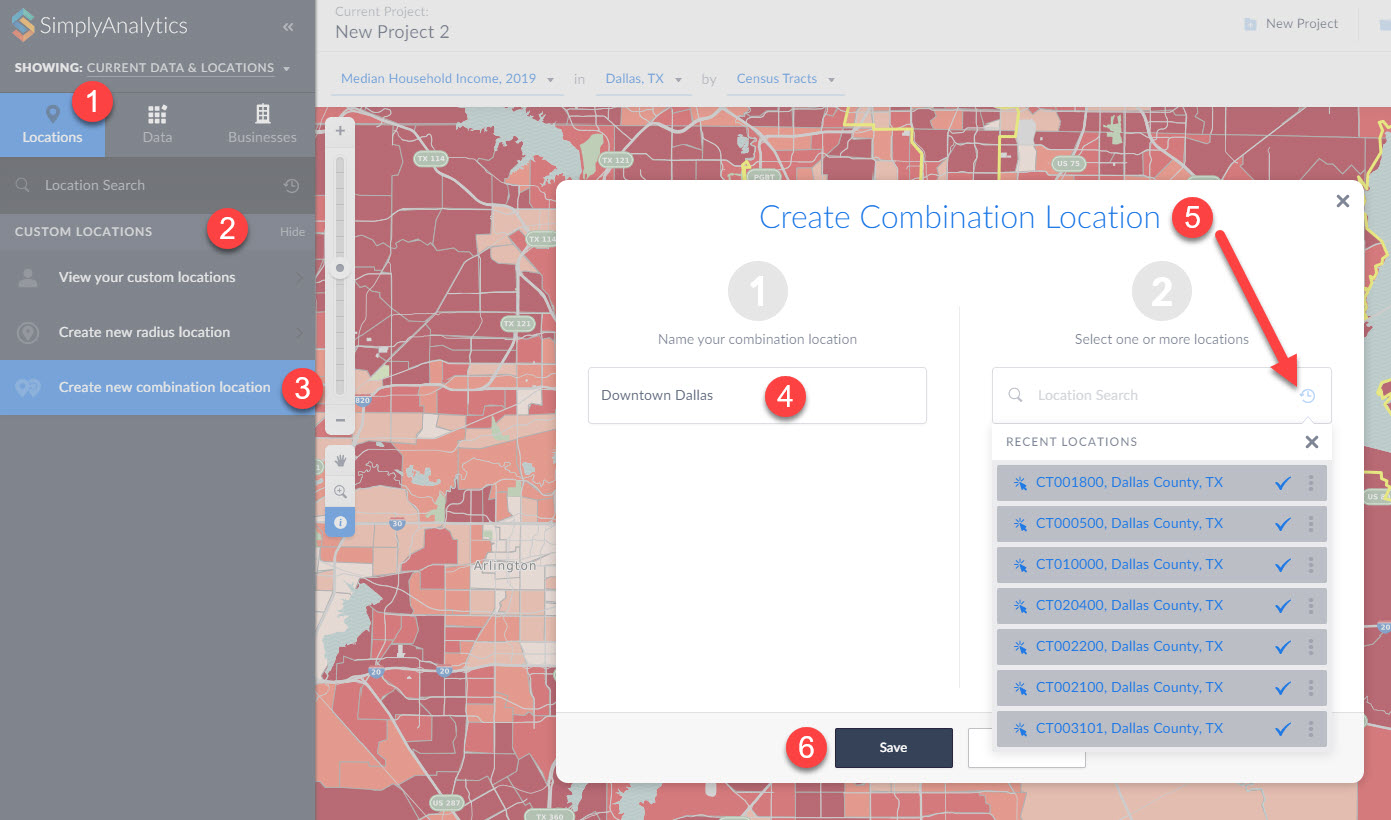
(5) If you have a list of locations that make up your custom location, you can enter them into box number 2. Alternatively, if you have previously used or favorited locations, you can easily access them by clicking on the respective icons within the Locations option as shown in step 5 above. (6) Click Save.
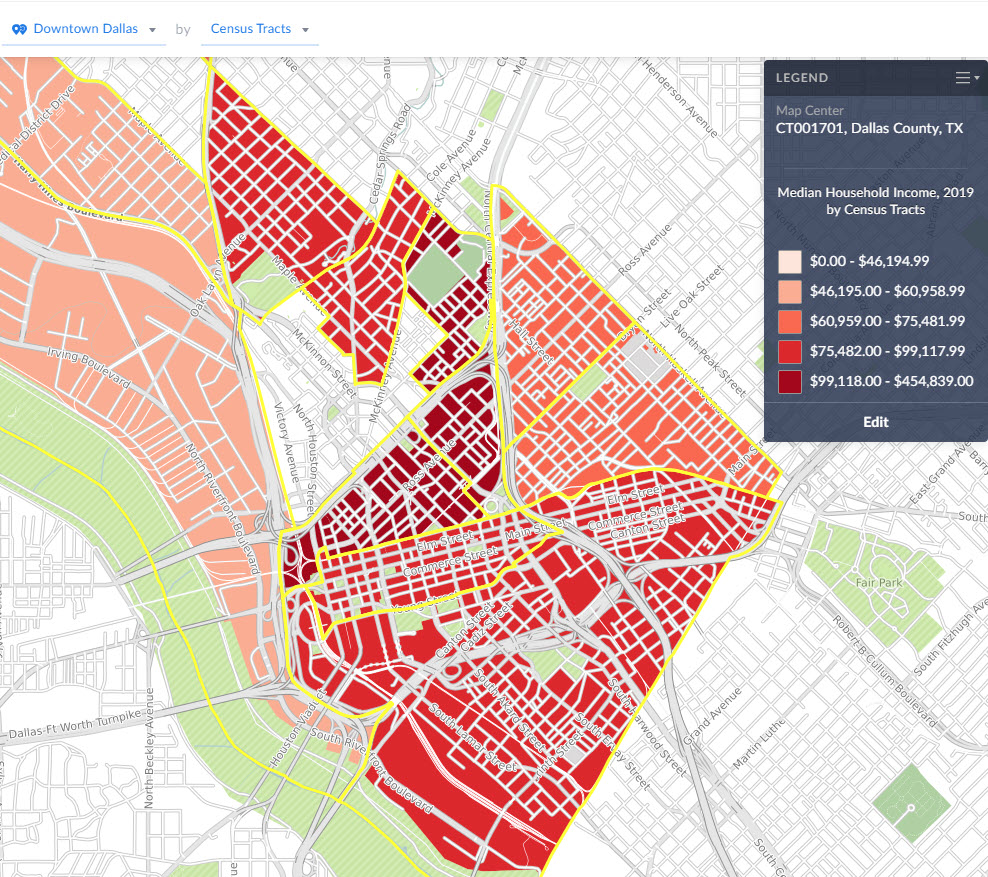
Your new location gets created and can now be mapped or used with any of the available reports in SimplyAnalytics:
That’s all we have for today - stay tuned for more!
More from SimplyAnalytics
Posted on Dec 02, 2019 by Admin
Hi everybody! We’re back this week with another question from our Help Desk. This time featuring SimplyAnalytics Canada. Let’s get started! Question: How can I analyze all of the PRIZM5 s...
Posted on Oct 07, 2013 by Admin
Do you know the quickest way to find the name of a Block Group, Census Tract or ZIP code in our upcoming release for 3.0? The i-Tool gives you the ability to click anywhere on a map to g...
Posted on May 26, 2016 by Admin
In this week’s report exploring SimplyMap data, we take a look at the variables available relative to internet search engines used. The source of this data will come from the SimmonsLOCAL...
Posted on Jun 21, 2022 by Admin
Hello readers! We hope you’re having a great day. Today we are featuring 5 commonly asked questions about the American Community Survey dataset that’s available to all customers in Simply...
Posted on May 23, 2019 by Admin
Come visit the SimplyAnalytics team at the Special Library Association's Annual Conference in Cleveland. Special librarians and other information professionals come together at SLA’s annu...
Posted on Feb 13, 2015 by Admin
In this week’s report exploring SimplyMap data, we want to find out where America’s remote workers reside. To find this, we can tap into the Census data in SimplyMap. The specific variabl...
Posted on Feb 24, 2019 by Admin
Visit with the SimplyAnalytics team at this year's 14th annual Electronic Resources & Libraries Conference in Austin, TX! You can find us at Table 207, where we will be available to a...
Posted on May 06, 2013 by Admin
We will be exhibiting at ALA 2013 at McCormick Place in Chicago, IL, June 28-July 1. The ALA Annual Conference programs, updates, conversations, and other events cover all of the key issu...
Posted on Dec 06, 2009 by Admin
ALA's Choice Magazine, publisher of independent reviews of products and services for academic libraries, released a new review of SimplyMap in the December 2009 edition. The reviewer, Car...
Posted on Jul 09, 2015 by Admin
In this week’s SimplyMap report, we set out to find which cities have the highest percentages of people who use their bike as their mode of transportation to work in the US. Let’s get sta...