


Exploring SimplyMap Data: Make of Vehicles
Posted on Aug 02, 2016 by Admin
Did you know that you can use SimplyMap to identify which make and model of vehicle is most prevalent within any location in the United States? In this week’s SimplyMap report, we’ll take a look at the SimmonsLOCAL data set to identify the top vehicle brands in select cities around the US. Let’s get started!
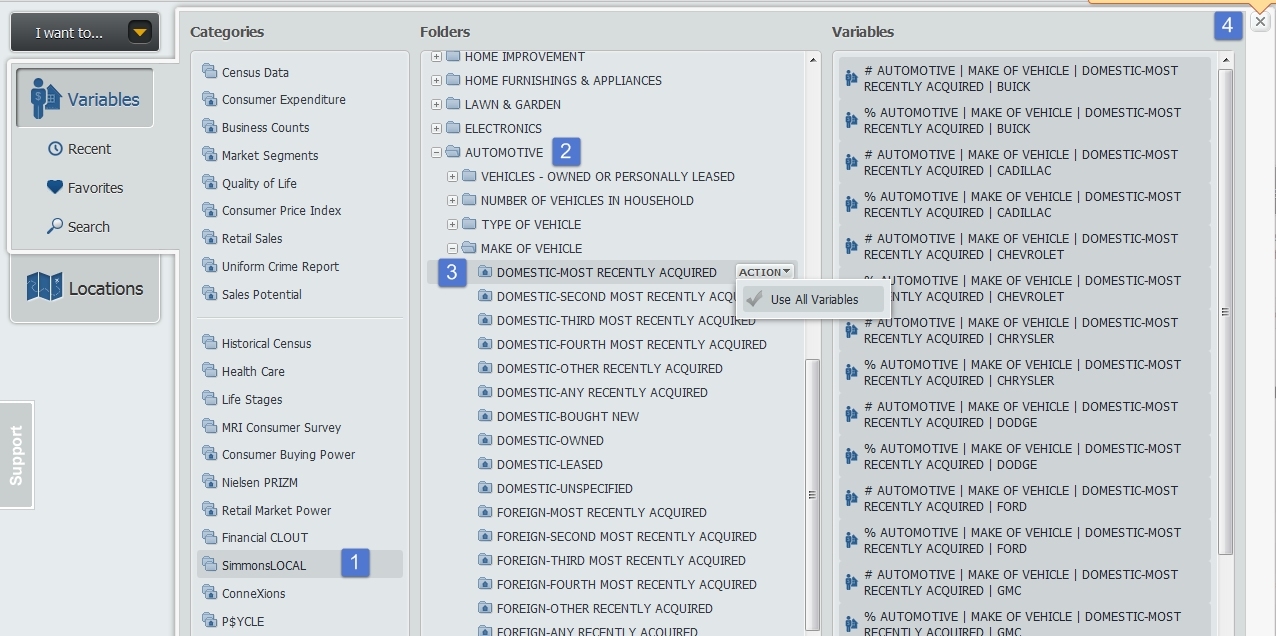
First, open up a Standard Report. For this example, we’ll focus on which domestic and foreign vehicles have been most recently acquired within our target areas. Accordingly, we will utilize the Use All Variables feature to add all variables within the two folders:
- DOMESTIC-MOST RECENTLY ACQUIRED
- FOREIGN-MOST RECENTLY ACQUIRED
When you close out the variables panel, a report for the United States is generated. Utilizing the Sort Descending feature, you can determine the top represented domestic and foreign cars that have been most recently purchased.
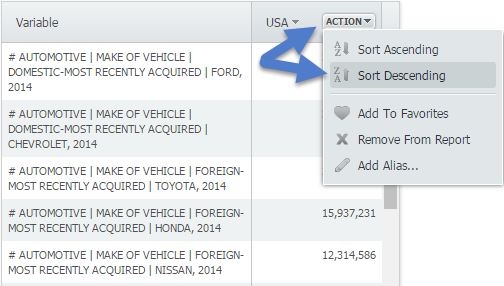
Results for the US:
- Ford - 34,042,678
- Chevrolet - 31,309,261
- Toyota - 24,672,205
- Honda - 15,937,231
- Nissan - 12,314,586
Now let’s take a look at the results for a few other cities:
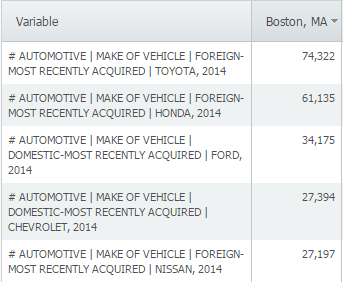
Boston:
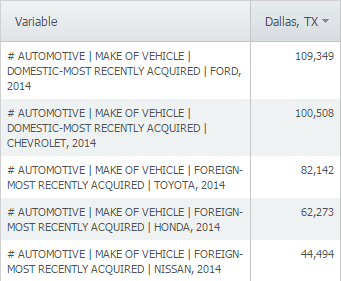
Dallas:
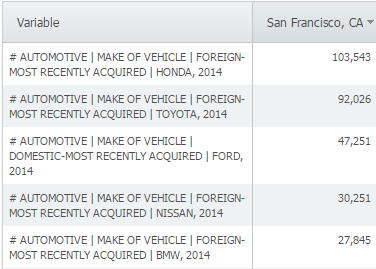
San Francisco:
If you want to see more detail on a particular model from a brand, utilize this path and add/sort all models from the brand: SimmonsLOCAL » AUTOMOTIVE » DOMESTIC VEHICLES - MAKE/MODEL » MOST RECENTLY ACQUIRED - DOMESTIC or FOREIGN
For example, looking at Boston, MA and adding all Toyota models reveals the following:
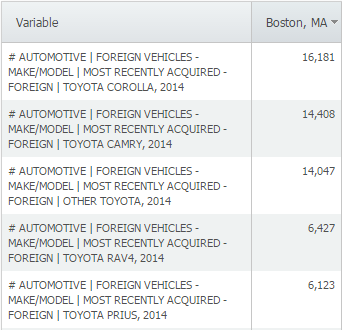
It looks like Boston is a big fan of Toyota Corollas. This data is available down to the block group level, so feel free to find out which make and model of vehicle is popular within your own neighborhood - stay tuned for more!
More from SimplyAnalytics
Posted on May 25, 2010 by Admin
The American Library Association 2010 Annual Conference is coming and the GRI team is gearing up for another great event this summer. We will be in Washington, D.C. again this year, June ...
Posted on Aug 26, 2015 by Admin
Most people in the United States could probably guess which cities are popular amongst tourists - Los Angeles and New York. But can you guess how much money is spent in novelty and souven...
Posted on Apr 23, 2018 by Admin
Hello everyone and welcome to this week’s blog. This week we will discuss how to create and utilize filters for your research. Why Use a Filter? Filters are a great way to identify target...
Posted on Oct 08, 2008 by Admin
Geographic Research, Inc. (GRI) is pleased to sponsor the fourth annual American Collegiate Retailing Association’s Undergraduate Student Retail Analysis Competition. This is the second ...
Posted on Mar 18, 2015 by Admin
Can you guess which US city has the most residents per square mile? Today we’re going to use SimplyMap to answer this question for all cities, as well as cities with a population greater ...
Posted on Jun 11, 2026 by Admin
SimplyAnalytics is excited to exhibit at ALA Annual 2026 in Chicago! Visit us at Booth #4336 to meet our team, ask questions, and learn more about the latest SimplyAnalytics features and ...
Posted on Oct 24, 2019 by Admin
Hi everybody! This week we wanted to bring you something unique, so we’re taking you behind the scenes to show you what goes in to setting up the SimplyAnalytics conference booth you’ve c...
Posted on Apr 10, 2015 by Admin
In this week’s SimplyMap report, we explore one of the newer datasets available: Retail Market Power®. What is it? In short, the Retail Market Power® dataset helps users identify opportun...
Posted on Oct 12, 2010 by Admin
NC LIVE, a member-driven library service organization dedicated to providing online information services that support education, enhance statewide economic development, and increase qu...
Posted on Dec 03, 2012 by Admin
Come visit the Geographic Research booth at the Ontario Library Association Super Conference this season. The conference will take place on January 30 - February 2, 2013 at the Metro Toro...