


American Community Survey Data in SimplyAnalytics
Posted on Jun 21, 2022 by Admin
Hello readers! We hope you’re having a great day. Today we are featuring 5 commonly asked questions about the American Community Survey dataset that’s available to all customers in SimplyAnalytics. Let’s get started.
What is the American Community Survey?
The American Community Survey (ACS) is an ongoing monthly/annual survey of over 3.5 million households in the US conducted by the U.S. Census Bureau. The ACS asks questions about topics such as education, employment, internet access, transportation, disability and more. These topics and the reported answers are useful to understand communities, and to help determine funding/programming needs. Here’s a wonderful explanation of why the ACS asks about each of these topics: https://www.census.gov/acs/www/about/why-we-ask-each-question/
What Years are Available in SimplyAnalytics?
Every SimplyAnalytics user has access to the following years of ACS data: 2010, 2011, 2012, 2013, 2014, 2015, 2016, 2017, 2018, 2019, 2020 (estimate), 2021 (estimate), 2025 (projection), 2026 (projection).
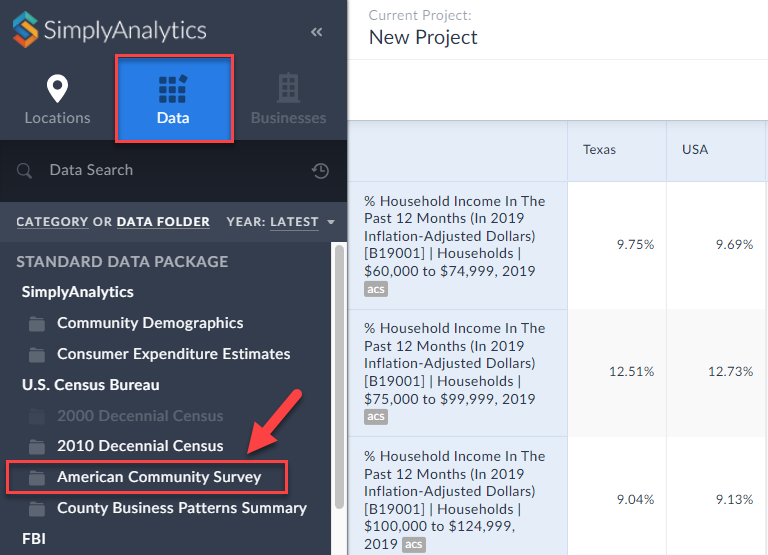
How can I access the ACS data in SimplyAnalytics?
You can jump directly to the ACS data folder by clicking on Browse by Data Folder from within the Data block at the top left of SimplyAnalytics.
 What type of data is available in the ACS?
Each year of the ACS includes thousands of data variables for users to choose from. Below is a list of the main topics - note that many of the folders below contain multiple subfolders.
What type of data is available in the ACS?
Each year of the ACS includes thousands of data variables for users to choose from. Below is a list of the main topics - note that many of the folders below contain multiple subfolders.
What type of data is available in the ACS?
Each year of the ACS includes thousands of data variables for users to choose from. Below is a list of the main topics - note that many of the folders below contain multiple subfolders.
- Age; Sex
- Race
- Hispanic or Latino Origin
- Ancestry
- Citizenship Status; Year of Entry; Foreign Born Place of Birth
- Place of Birth
- Migration/Residence 1 Year Ago
- Commuting (Journey to Work); Place of Work
- Relationship to Householder
- Grandparents and Grandchildren Characteristics
- Household Type; Family Type; Subfamilies
- Marital Status; Marital History
- Fertility
- School Enrollment
- Educational Attainment; Undergraduate Field of Degree
- Language Spoken at Home
- Poverty Status
- Disability Status
- Income
- Earnings
- Veteran Status; Period of Military Service
- Food Stamps/Supplemental Nutrition Assistance Program (SNAP)
- Employment Status; Work Status Last Year
- Industry, Occupation, and Class of Worker
- Housing Characteristics
- Group Quarters
- Health Insurance Coverage
- Computer and Internet Use
- Citizen Voting-Age Population
- Quality Measures
- Allocation Table for Any Subject
- Map View: Create a map of a city, and visualize the Census Tracts by % of households that have moved in within the past year from a different state
- Ranking Report: Rank the ZIP Codes in a state with the highest % of households who do not have a computer
- Comparison Report: Research disability data in your home Census Tract, and compare that data with the ZIP Code, County, State, and US.
More from SimplyAnalytics
Posted on Jan 16, 2026 by Admin
We are excited to be exhibiting at the Public Library Association (PLA) 2026 Conference in Minneapolis this April 1-3!
Posted on May 08, 2018 by Admin
We will be exhibiting at the SLA conference in Baltimore, MD this June. Stop by booth #912 and say hello - we look forward to demonstrating SimplyAnalytics, answering your questions, and ...
Posted on Apr 30, 2020 by Admin
We find ourselves in the middle of an unprecedented crisis the likes of which most of us have never experienced before, and hopefully won’t have to experience again. There is the occasion...
Posted on Mar 03, 2016 by Admin
In this week’s SimplyMap report we take a look into the SimmonsLOCAL dataset to determine which cities in America have the highest percentage of residents who consume organic food product...
Posted on Jul 28, 2013 by Admin
We recently discovered some interesting data on participation and attitudes towards recycling, and decided to dig a bit deeper into our Experian SimmonsLOCAL data. This data package inclu...
Posted on Feb 26, 2014 by Admin
The Statewide California Electronic Library Consortium is holding another packed week of workshops and networking during the SCELCapalooza event in March 2014. Geographic Research will b...
Posted on May 23, 2019 by Admin
Come visit the SimplyAnalytics team at the Special Library Association's Annual Conference in Cleveland. Special librarians and other information professionals come together at SLA’s annu...
Posted on Nov 23, 2012 by Admin
Men's Health magazine is charting vanity in US cities, with help from SimplyMap. What did they find? The Sunshine State, with a long history of going to great lengths to look good, tops t...
Posted on Dec 08, 2017 by Admin
Good afternoon, readers! This week we’re going to talk about project management in SimplyAnalytics and how to best take advantage of it. Why are projects needed? Many users have multiple...
Posted on Mar 02, 2015 by Admin
In this week’s SimplyMap tip, we outline the process of creating a radius location. Radius locations are a great way to quickly gather information from an area surrounding a target addres...