


View Spotlight - Time Series Table
Posted on Aug 27, 2018 by Admin
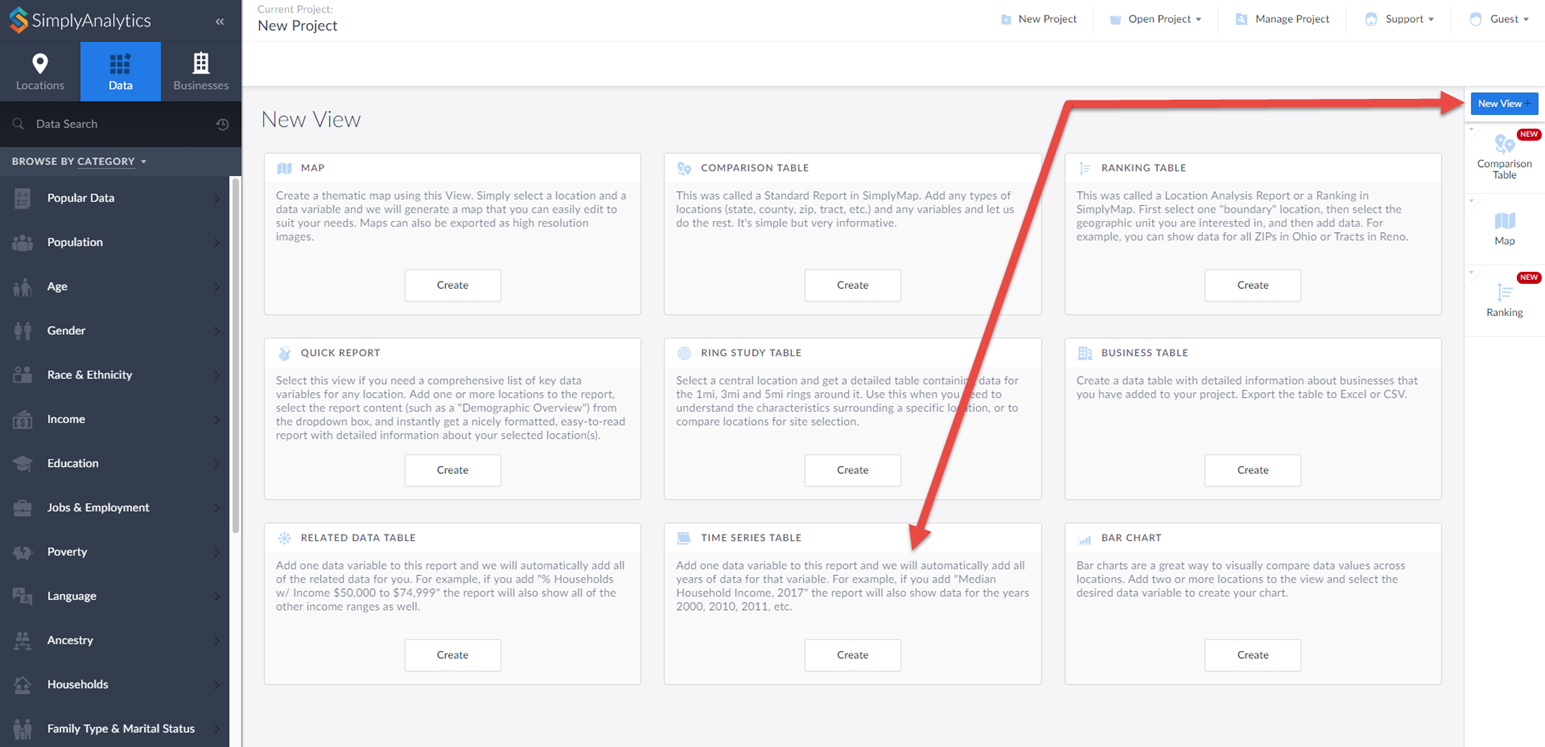
Welcome readers! This week we are excited to feature our newest view in SimplyAnalytics, the Time Series Table.What is it?The Time Series Table allows you to quickly pull all years available for a variable of your choosing. This allows you to easily identify trends over time.ExampleYou want to track the trend of median household income across some target locations.In your project, select New View towards the top-right of your screen and select Time Series Table.
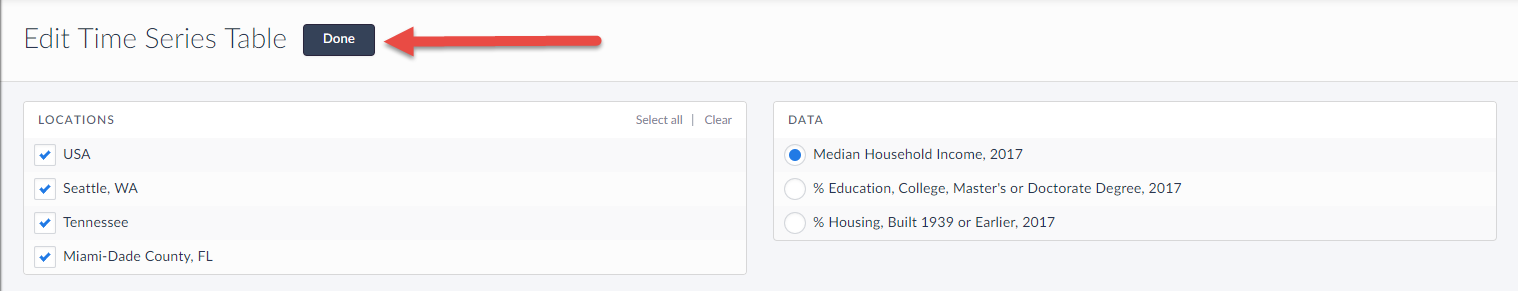
This opens up the Edit View screen. Specify Median Household Income and the locations you want to view the trends for. Click on Done to generate your table.
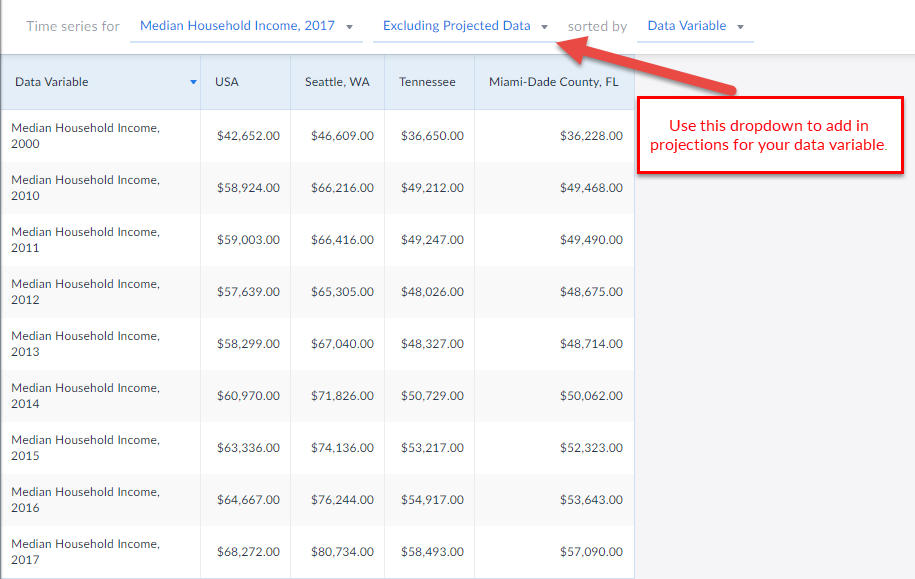
 And that’s all there is to it! You can use the dropdowns to change variables or add in projections for that data variable.
 We hope you’re as excited as we are about this new view - let us know if you have any questions or suggestions for future features or blogs.
More from SimplyAnalytics
Posted on Nov 29, 2009 by Admin
The ALA 2010 Midwinter Meeting will be held on January 15-19, 2010 at the Boston Convention and Exhibition Center. (Note that this is not the Hynes Convention Center). Geographic Research...
Posted on Sep 10, 2019 by Admin
Hello readers! It’s been a minute since our last tutorial post, but you can expect to see more content on a weekly basis moving forward. “From the Help Desk” is a new feature on the blog ...
Posted on Dec 15, 2014 by Admin
Custom Locations allow SimplyMap users to combine several locations into one larger region. For example, you can use this feature to combine three adjacent ZIP Codes to create your study ...
Posted on Sep 15, 2016 by Admin
While creating a radius location is the fastest and easiest method for creating a custom location, there may be situations that require a more specific and targeted locale. Let’s say for ...
Posted on Nov 28, 2012 by Admin
Come visit the SimplyMap team at the ALA Midwinter Meeting, January 25 - 28, 2013 in Seattle, WA. We will be in Booth 1307, and as always we look forward to meeting with customers new and...
Posted on Mar 02, 2018 by Admin
In this week’s blog we’ll take a look at how to enter an address in SimplyAnalytics to find the Census Block Group or Census Tract. Let’s get started! Use Case: You want to analyze the ar...
Posted on May 23, 2012 by Admin
We will be exhibiting at the Special Libraries Association (SLA) annual conference and Info-Expo at McCormick Place in Chicago Sunday June 15th - Tuesday July 17th. Visit us at Booth 124 ...
Posted on Dec 08, 2017 by Admin
Good afternoon, readers! This week we’re going to talk about project management in SimplyAnalytics and how to best take advantage of it. Why are projects needed? Many users have multiple...
Posted on Sep 28, 2018 by Admin
Welcome readers! Today we have a quick feature highlight that will assist you in browsing and searching for data variables. All data variables have a path where they reside within their d...
Posted on Dec 16, 2015 by Admin
Visit the SimplyMap team at the ALA Midwinter Meeting 2016 in Boston. We will be at booth #1913 offering product demonstrations, tips & tricks, and of course Ghirardelli Chocolate! Ex...