


Variable Menu Improvements & More
Posted on Dec 07, 2021 by Admin
Hello readers! We hope you are enjoying the holiday season as much as we are. Today, we are happy to announce a couple of improvements to SimplyAnalytics designed to help you get your research done more efficiently. Let’s check it out!
Variable Menu Changes
This first of two changes to the variable menus is rooted in customer suggestions that revolved around the same sort of question, namely: is there a way to quickly add in additional years or the # or % version of this variable? As of this week, the answer to this question is yes!
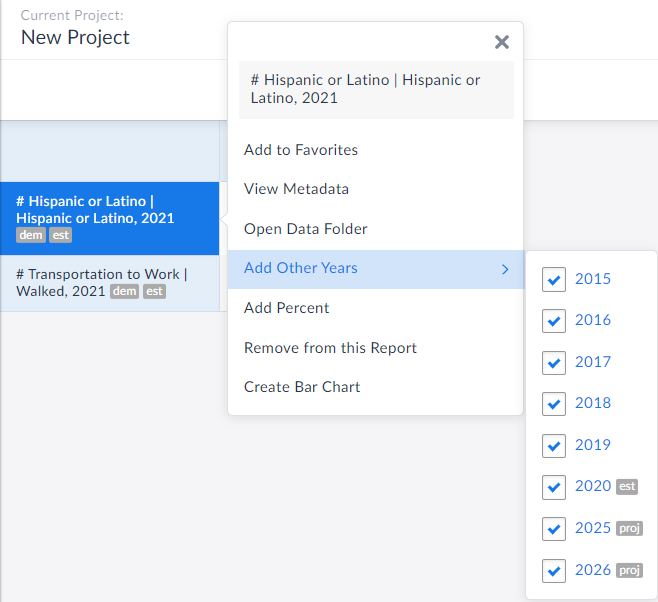
Now, when you are in a report and want to add in other years of data quickly, simply click on the variable name and refer to the Add Other Years text in the menu that displays.
In the example below, the chosen data variable is # Hispanic or Latino Population for the year 2021, but notice in the Add Other Years option, you are now welcome to instantly add in years from 2015, 2016, 2017, 2018, 2019, 2020, 2025 and 2026.
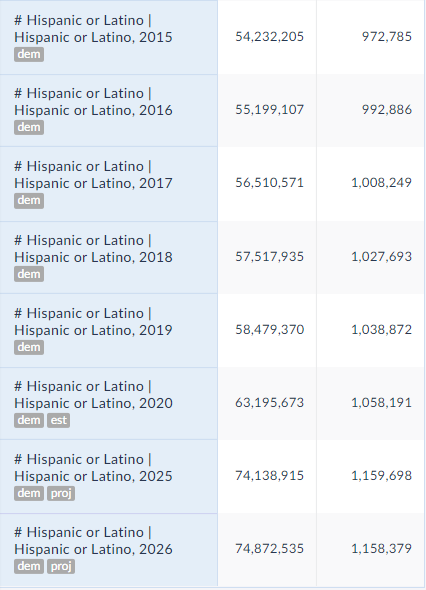
 All you need to do is select the desired year(s), close out the menu/click away and voila! The new years are automatically added to your report:
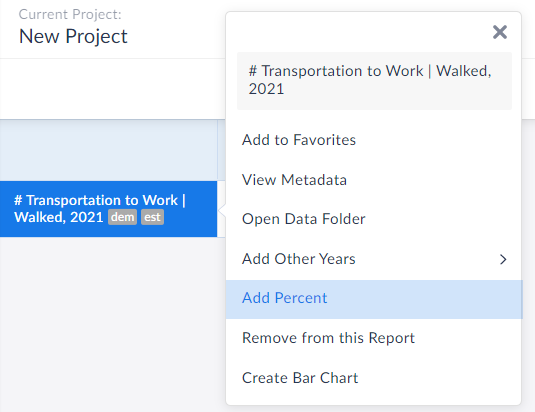
 Equally great is that users now have the ability to add in the other variation of your presently selected variable. For example, if you have # of adults walking to work in your report, you can immediately add in the % variation. This is also available from within the variable menu.
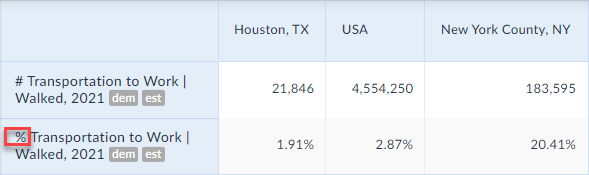
 The percent version is now added to your report:
 Create Data Table from Visualizations
We also wanted to update readers on this wonderful new feature that has flown under the radar, but is extremely useful.
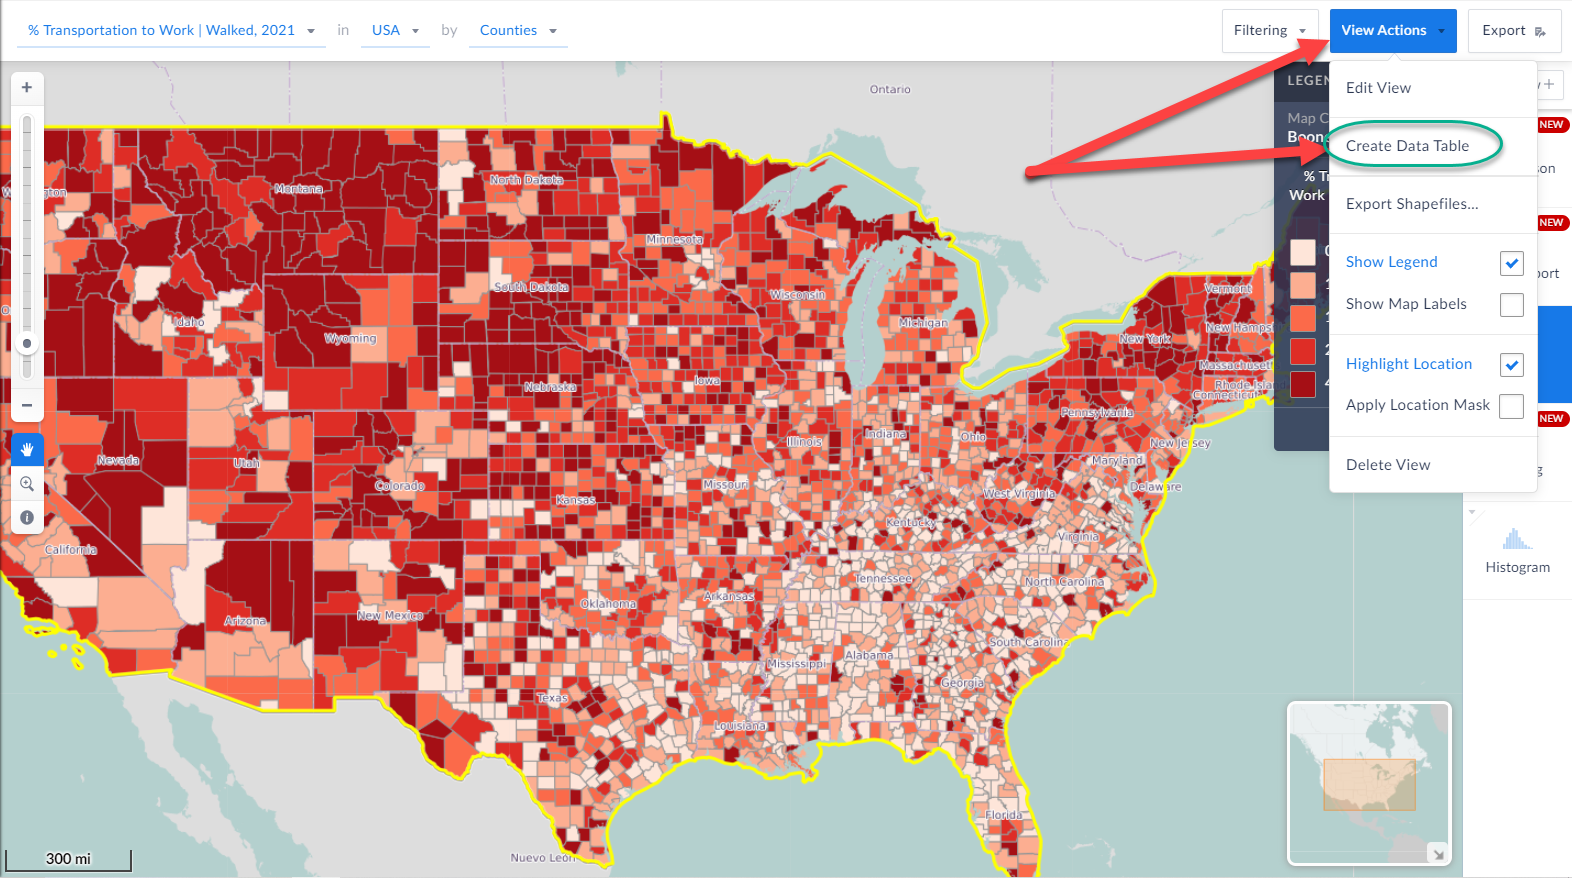
When you are in a visualization such as a map or histogram or bar chart, you are now able to instantly create a data table based on the underlying data of the visualization.
Check it out!
All you have to do is click on View Actions > Create Data Table and SimplyAnalytics will automatically generate a table for you. How cool is that?!
Create Data Table from Visualizations
We also wanted to update readers on this wonderful new feature that has flown under the radar, but is extremely useful.
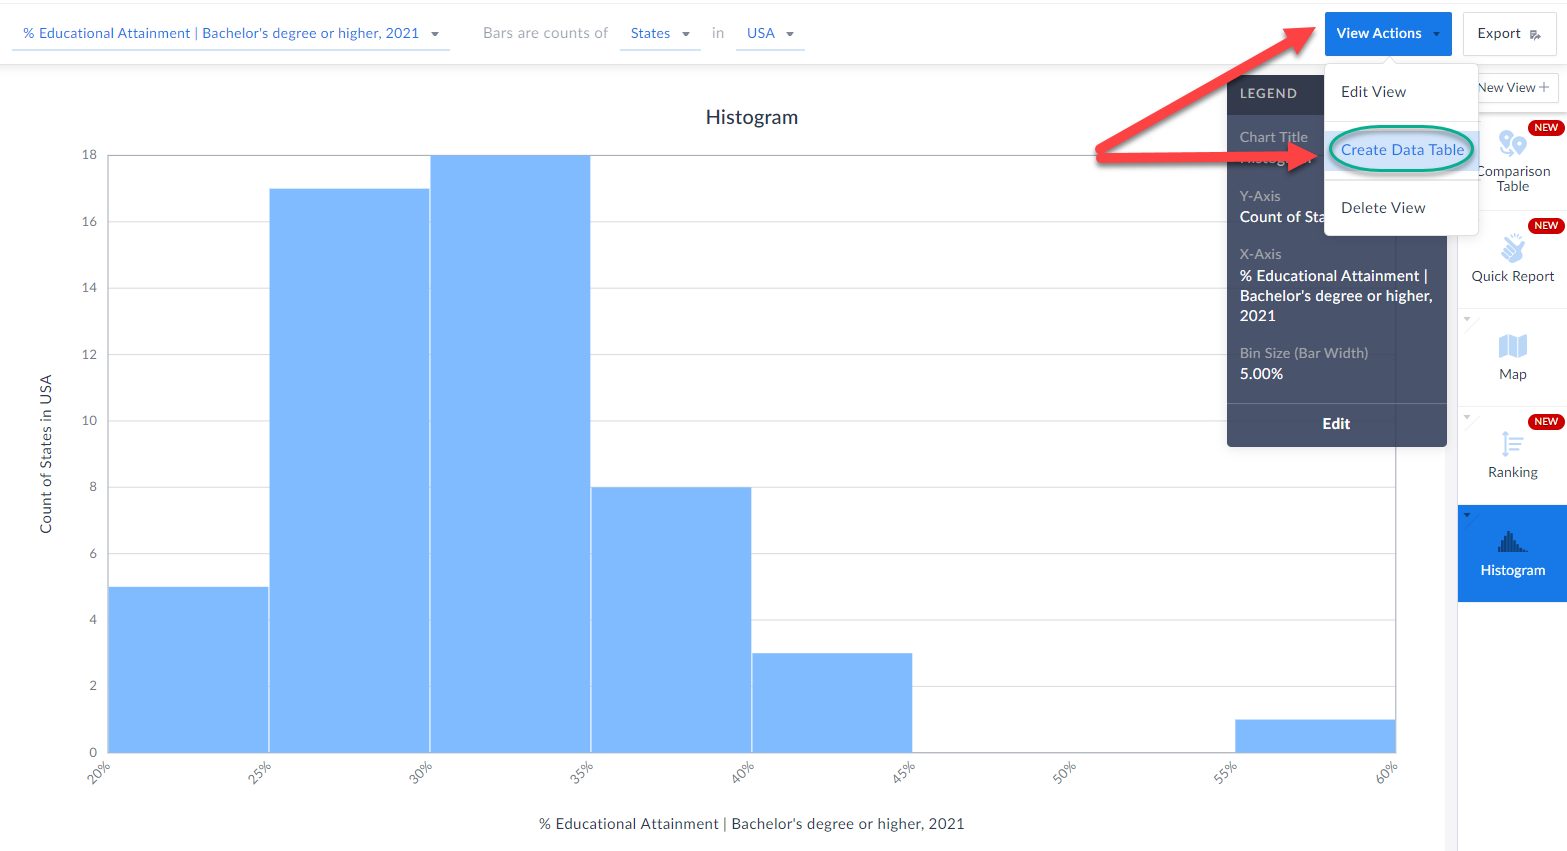
When you are in a visualization such as a map or histogram or bar chart, you are now able to instantly create a data table based on the underlying data of the visualization.
Check it out!
All you have to do is click on View Actions > Create Data Table and SimplyAnalytics will automatically generate a table for you. How cool is that?!
 We hope you enjoy these new enhancements to SimplyAnalytics - thank you as always for sending us these types of suggestions for improvements, we do listen!
Have a wonderful remainder of 2021, and as always please feel free to email us at anytime at: support@simplyanalytics.com
We hope you enjoy these new enhancements to SimplyAnalytics - thank you as always for sending us these types of suggestions for improvements, we do listen!
Have a wonderful remainder of 2021, and as always please feel free to email us at anytime at: support@simplyanalytics.com
All you need to do is select the desired year(s), close out the menu/click away and voila! The new years are automatically added to your report:
Equally great is that users now have the ability to add in the other variation of your presently selected variable. For example, if you have # of adults walking to work in your report, you can immediately add in the % variation. This is also available from within the variable menu.
The percent version is now added to your report:
Create Data Table from Visualizations
We also wanted to update readers on this wonderful new feature that has flown under the radar, but is extremely useful.
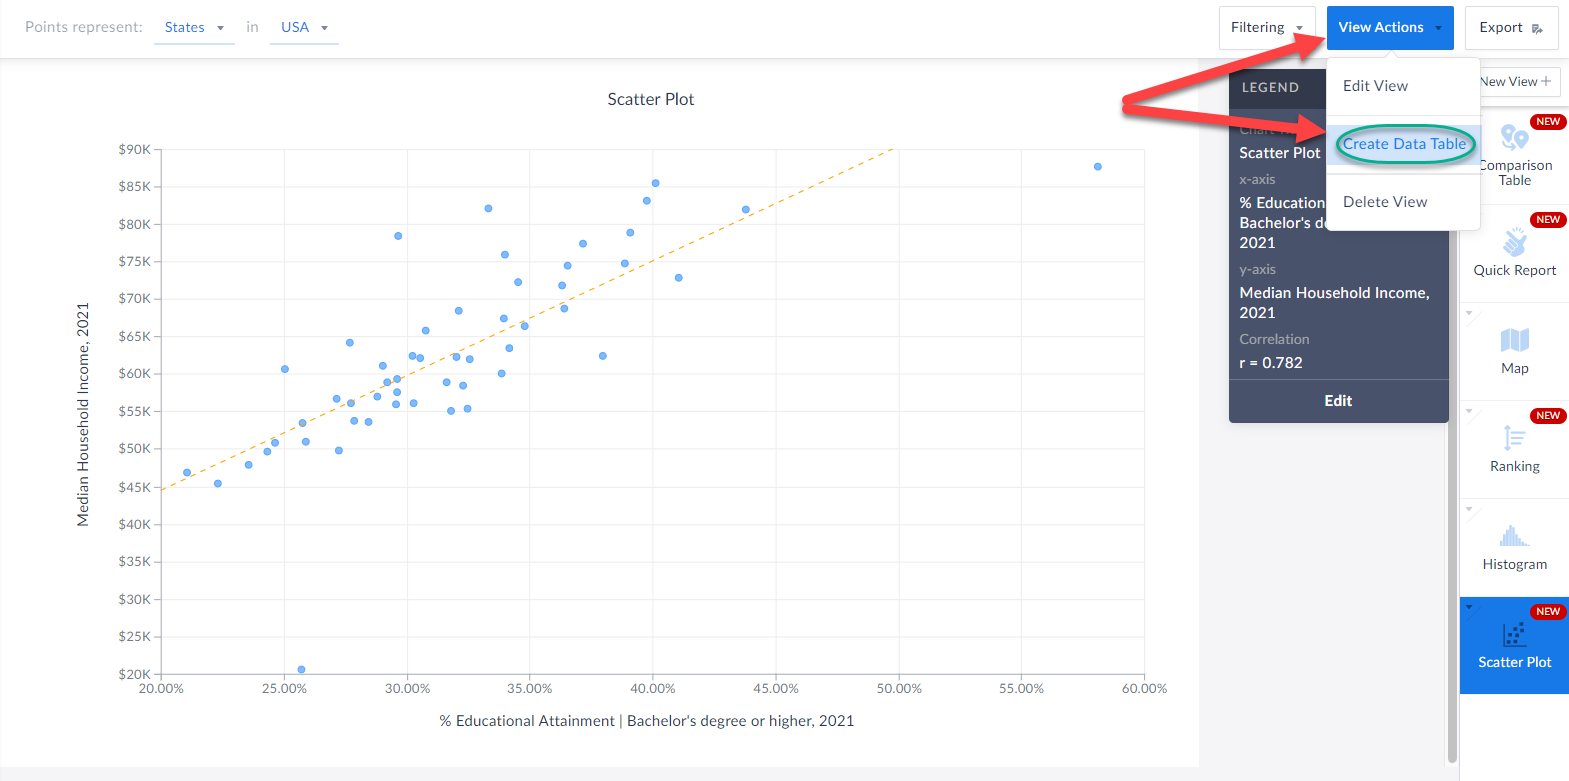
When you are in a visualization such as a map or histogram or bar chart, you are now able to instantly create a data table based on the underlying data of the visualization.
Check it out!
All you have to do is click on View Actions > Create Data Table and SimplyAnalytics will automatically generate a table for you. How cool is that?!
We hope you enjoy these new enhancements to SimplyAnalytics - thank you as always for sending us these types of suggestions for improvements, we do listen!
Have a wonderful remainder of 2021, and as always please feel free to email us at anytime at: support@simplyanalytics.com
More from SimplyAnalytics
Posted on Jun 16, 2016 by Admin
This week’s SimplyMap report is a quick tip that we hope you find useful and time saving. Did you know that SimplyMap will save all recently searched business queries for future usage? Le...
Posted on Sep 10, 2010 by Admin
SimplyMap Canada is now available at several Canadian institutions, including York University and Ryerson University, in Toronto. SimplyMap Canada has all of the great features included i...
Posted on Apr 01, 2014 by Admin
Another fantastic series of workshops and events are planned at the SLA Conference on June 8-10th, 2014. Register now for networking and workshops throughout the week. Over 200 events are...
Posted on Nov 29, 2009 by Admin
The ALA 2010 Midwinter Meeting will be held on January 15-19, 2010 at the Boston Convention and Exhibition Center. (Note that this is not the Hynes Convention Center). Geographic Research...
Posted on Dec 30, 2009 by Admin
Skokie Public Library, in Skokie, IL has published a useful overview of SimplyMap on the Mike's Space blog on SkokieNet. The article is filled with examples of research questions that can...
Posted on Feb 05, 2015 by Admin
In this week’s edition of exploring SimplyMap data, we take a look at America’s coffee drinkers. SimplyMap contains more than 100 coffee related variables, including consumer spending on ...
Posted on Dec 03, 2012 by Admin
Come visit the Geographic Research booth at the Ontario Library Association Super Conference this season. The conference will take place on January 30 - February 2, 2013 at the Metro Toro...
Posted on Dec 07, 2011 by Admin
We will be exhibiting at the American Library Association Midwinter Meeting & Exhibition in Dallas this January. Visit us at booth 2513 for a demonstration and to have all your Simply...
Posted on Mar 18, 2015 by Admin
Can you guess which US city has the most residents per square mile? Today we’re going to use SimplyMap to answer this question for all cities, as well as cities with a population greater ...
Posted on Feb 20, 2018 by Admin
We are looking forward to attending the annual SCELC (Statewide California Electronic Library Consortium) Vendor day, at Loyola Marymount University in Los Angeles on March 8th. In additi...