


Feature Highlight - Jump to Path
Posted on Sep 28, 2018 by Admin
Welcome readers! Today we have a quick feature highlight that will assist you in browsing and searching for data variables.
All data variables have a path where they reside within their datasets. For example, the data variable: % Education, College, Master's or Doctorate Degree can be found at this dataset path: Census Data » People and Households » Education » Attainment.
Each » reflects a different folder and subfolder. In the above example, the Attainment folder is within the Education folder that is found under People and Households within the Census Data.
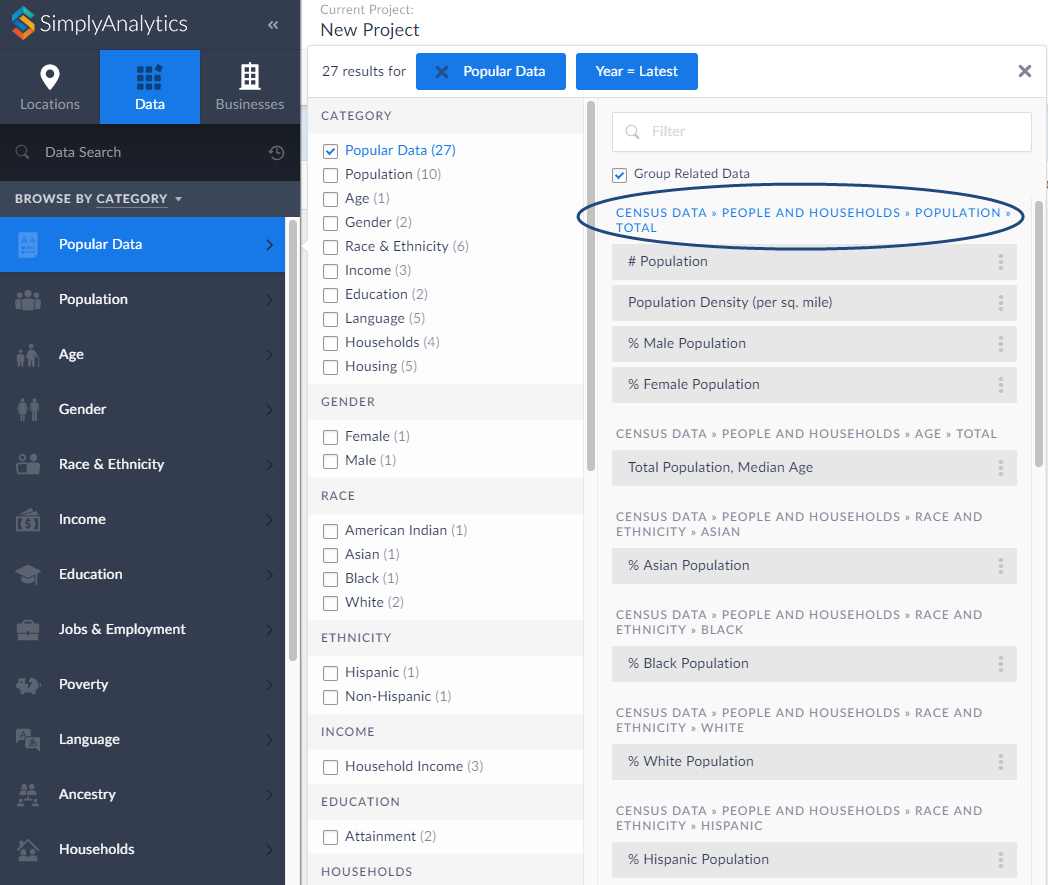
Did you know that you can jump into the folder directly from your category search? Simply click on the folder path at the top of the search results. as shown below:
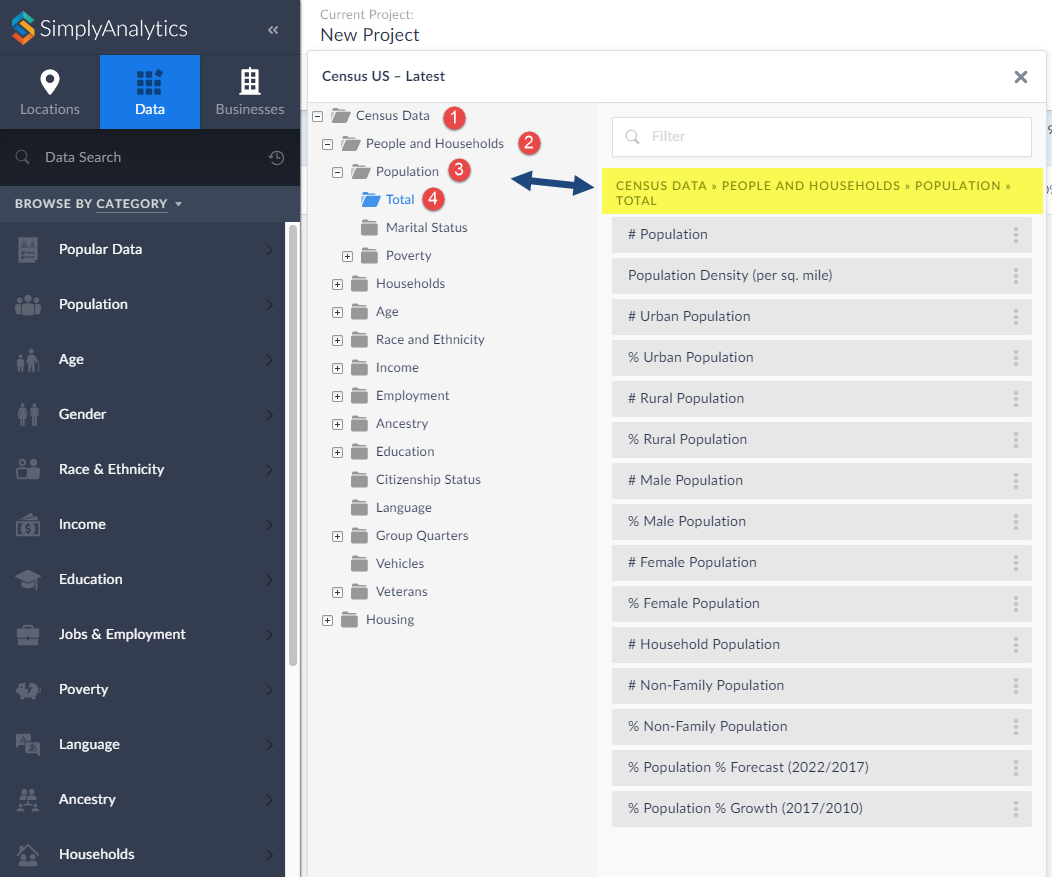
This will open up the folder where you can view all variables that reside there:
That’s all there is to it! We hope you enjoyed this quick tip today. Please feel free to reach out to us if you’d like to review a specific feature or data.
More from SimplyAnalytics
Posted on Nov 03, 2017 by Admin
This week we’ll talk about one of our favorite features in SimplyAnalytics - the custom combination location. This feature is a simple and effective means to create custom geographies whe...
Posted on Oct 08, 2008 by Admin
Geographic Research, Inc. (GRI) is pleased to sponsor the fourth annual American Collegiate Retailing Association’s Undergraduate Student Retail Analysis Competition. This is the second ...
Posted on Feb 23, 2012 by Admin
Geographic Research, Inc. will be exhibiting at the Public Library Association (PLA) Conference. Visit us at Booth 2329 to learn more about SimplyMap and enter our raffle for a new com...
Posted on Dec 07, 2011 by Admin
We will be exhibiting at the American Library Association Midwinter Meeting & Exhibition in Dallas this January. Visit us at booth 2513 for a demonstration and to have all your Simply...
Posted on Dec 02, 2019 by Admin
Hi everybody! We’re back this week with another question from our Help Desk. This time featuring SimplyAnalytics Canada. Let’s get started! Question: How can I analyze all of the PRIZM5 s...
Posted on Feb 20, 2018 by Admin
We are looking forward to attending the annual SCELC (Statewide California Electronic Library Consortium) Vendor day, at Loyola Marymount University in Los Angeles on March 8th. In additi...
Posted on Jan 17, 2011 by Admin
Come visit the Geographic Research booth at the Ontario Library Association Super Conference this season. The conference will take place on February 2-5, 2011 at the Metro Toronto Convent...
Posted on May 08, 2018 by Admin
We will be exhibiting at the SLA conference in Baltimore, MD this June. Stop by booth #912 and say hello - we look forward to demonstrating SimplyAnalytics, answering your questions, and ...
Posted on Dec 11, 2023 by Admin
Hello readers! We have some fantastic news to share. SimplyAnalytics is thrilled to announce the addition of 2020 Election data to our expanding collection of powerful datasets. With this...
Posted on Feb 26, 2014 by Admin
The Statewide California Electronic Library Consortium is holding another packed week of workshops and networking during the SCELCapalooza event in March 2014. Geographic Research will b...