


Feature Highlight: Data Filters
Posted on Apr 23, 2018 by Admin
Hello everyone and welcome to this week’s blog. This week we will discuss how to create and utilize filters for your research.
Why Use a Filter?
Filters are a great way to identify target areas that meet multiple conditions.
Use Case
You want to identify areas of San Antonio to market your afterschool program that is aimed towards low income and low educational attainment areas. You can use a data filter to help find the target areas.
Example
First, we will identify the target areas by creating an income filter and mapping the education attainment variable. Let’s get started.
1.Create the project by entering the target location for analysis in the Location field. In this example, the city of San Antonio, TX.
2. Map the variable % Education, College, Masters or Doctorate Degree. This is one of the 3 default data variables available when creating a project.
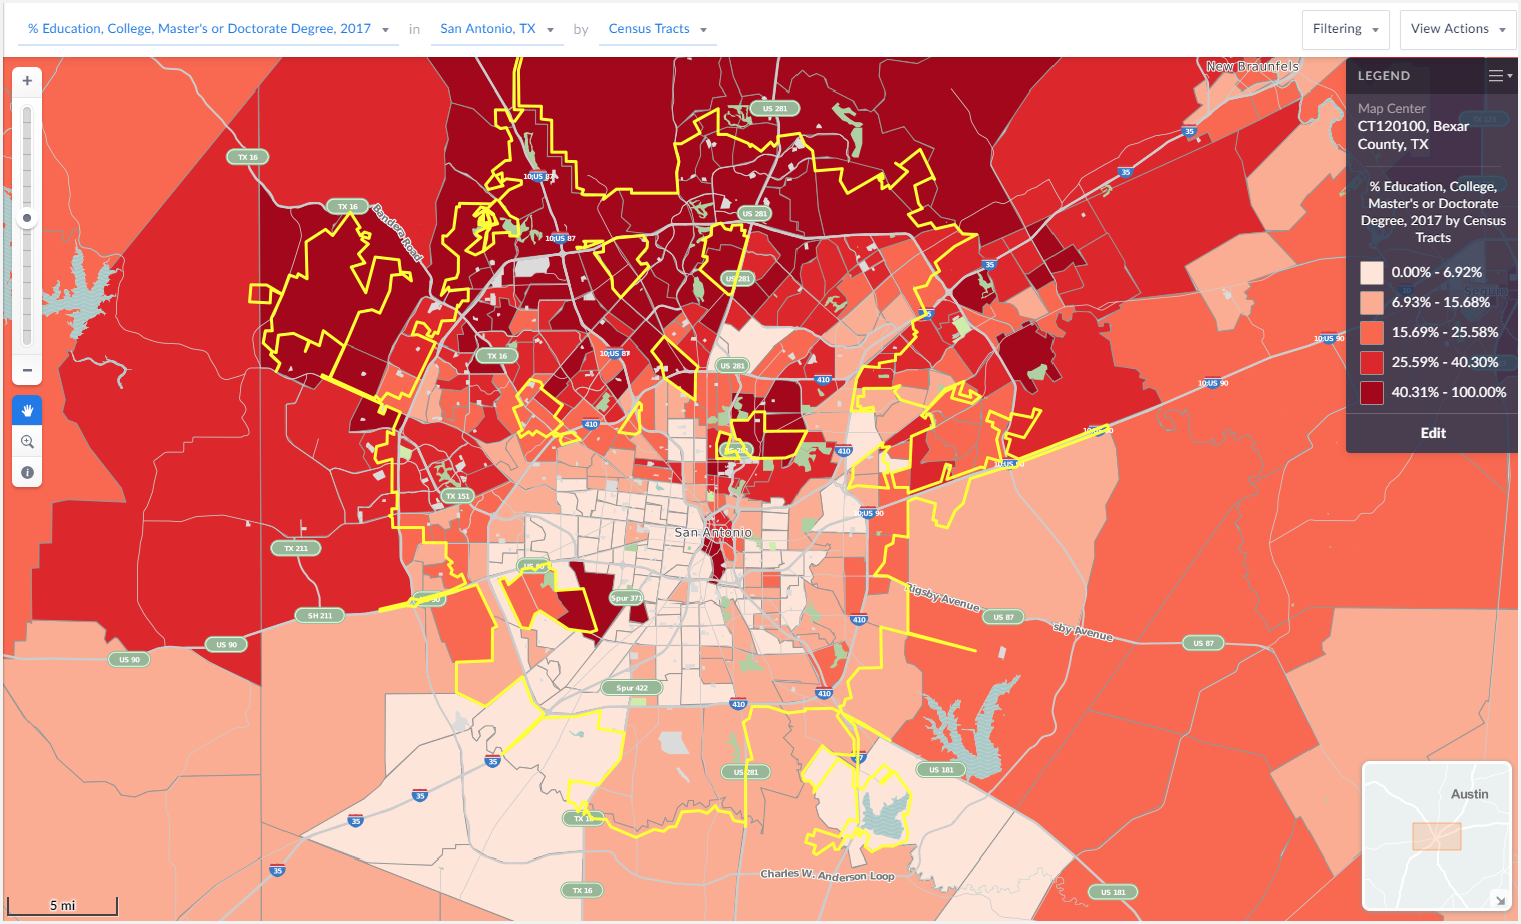
The darker areas of the map represent highly educated areas whereas the lighter areas reflect areas where a smaller percentage of residents have a college degree.
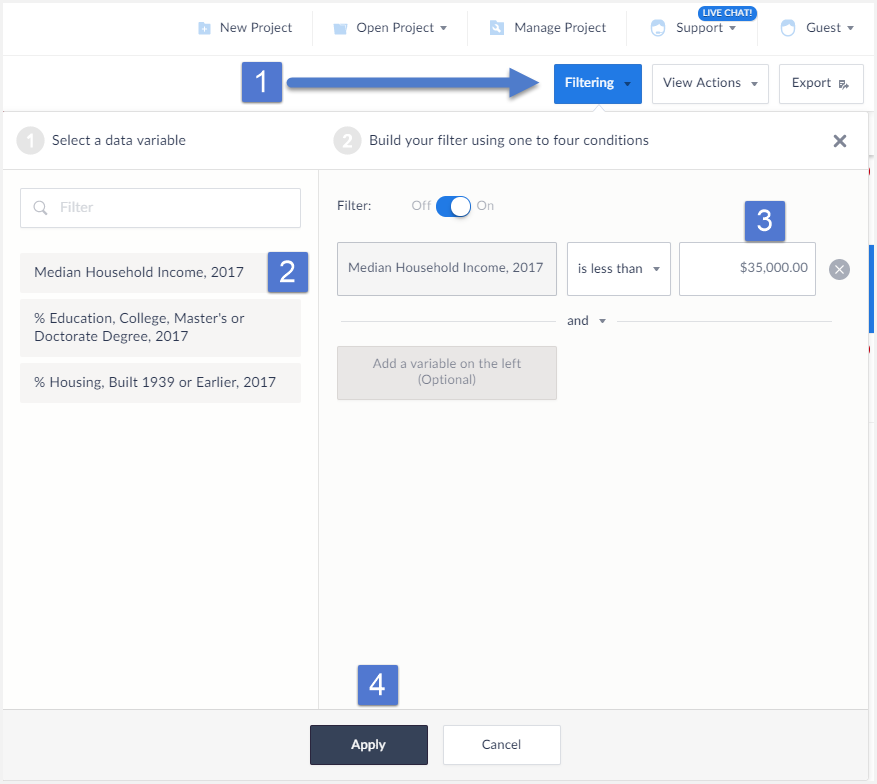
Next, create the income data filter.
- Select Filtering from the top Right of the interface. This will bring up the filter menu.
- Select a variable to act as a condition, in this example we want the Median Income variable.
- Enter a value for the condition (less than $35,000) and select Apply.
The filter gets applied to your map.
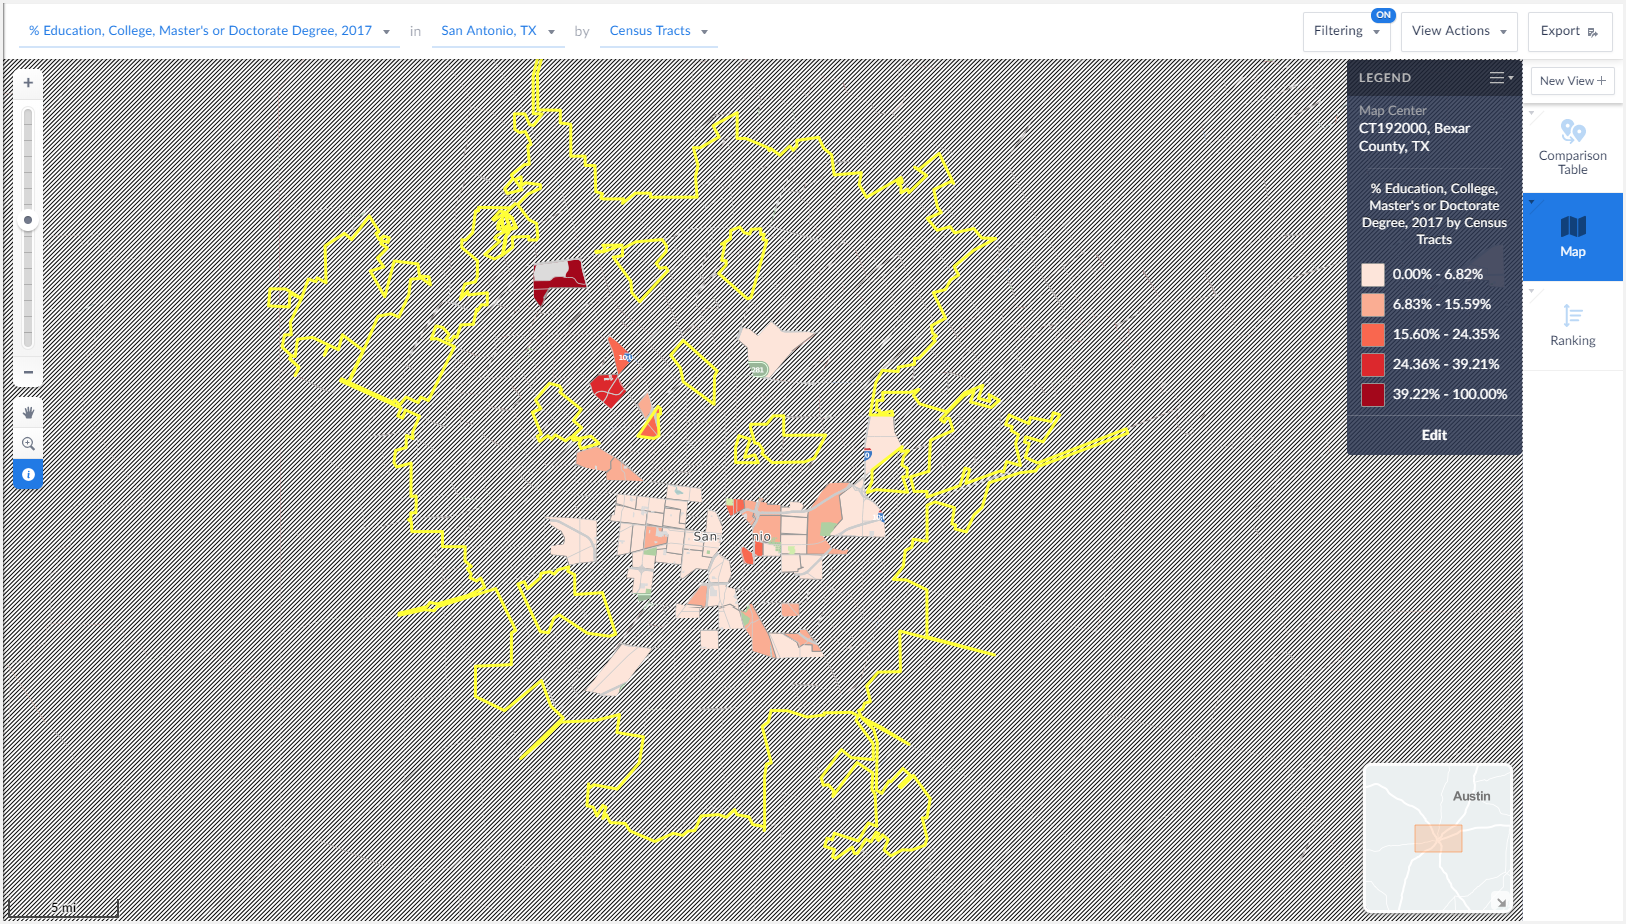
The final map image above reveals Census Tracts that meet our income criteria - looking at the still visible mapped areas provides the user with some ideal locations to market their program to.
That’s it for this week’s report! Stay tuned for more SimplyAnalytics how-tos and tips and send us your questions at support@simplyanalytics.com. If we feature your question in a future blog post, we’ll treat you to a $10 Starbucks gift card!
More from SimplyAnalytics
Posted on Sep 05, 2019 by Admin
SimplyAnalytics will be exhibiting at the biennial North Carolina Library Association conference, to be held this year at the Winston-Salem Benton Convention Center. If you are attending,...
Posted on May 25, 2010 by Admin
We will be exhibiting at the 2010 SLA Annual Conference & INFO-EXPO June 13-15 at the Ernest N. Morial Convention Center in New Orleans, LA. Join us at booth 1537 - bring your quest...
Posted on Dec 03, 2012 by Admin
Come visit the Geographic Research booth at the Ontario Library Association Super Conference this season. The conference will take place on January 30 - February 2, 2013 at the Metro Toro...
Posted on Apr 27, 2015 by Admin
In this week’s write up we want to share some quick tips and tricks that you might not yet know about in SimplyMap. TIP #1 Did you know that you can share your work? SimplyMap allows you ...
Posted on Apr 17, 2018 by Admin
The SimplyAnalytics team would like to congratulate Rachel Holder, MLS candidate at Indiana University for being selected as this year's recipient of the BRASS Student Travel Award! ...
Posted on Sep 01, 2008 by Admin
The King County Library System in Washington State now subscribes to SimplyMap, and has published a brief review on their blog, Library Talk.
Posted on Jun 09, 2016 by Admin
In this week’s blog, we’ll be featuring our newest data offering, PRIZM® Premier. If your institution currently subscribes to PRIZM data, this new module is available at no additional cos...
Posted on Sep 28, 2018 by Admin
Welcome readers! Today we have a quick feature highlight that will assist you in browsing and searching for data variables. All data variables have a path where they reside within their d...
Posted on Jun 02, 2017 by Admin
We will be exhibiting at SLA in Phoenix, AZ on June 18th-20th. You can find the SimplyAnalytics team at Booth #905. Stop by and check out our groundbreaking new interface, have a chocolat...
Posted on Aug 30, 2009 by Admin
Jeff Zaslow, Wall Street Journal columnist and co-author of the The Last Lecture, will speak at the Orlando, FL Public Library on Friday, September 11 at 7 p.m. Zaslow helped the late Ran...