


Exploring SimplyMap Data: Retail Market Power
Posted on Apr 10, 2015 by Admin
In this week’s SimplyMap report, we explore one of the newer datasets available: Retail Market Power®.
What is it? In short, the Retail Market Power® dataset helps users identify opportunities within the industry they are targeting. These gaps are identified by analyzing expenditures and retail sales. Marketers can focus on targeting areas where the expenditures far exceed the total sales.
Let’s take a look at an example.
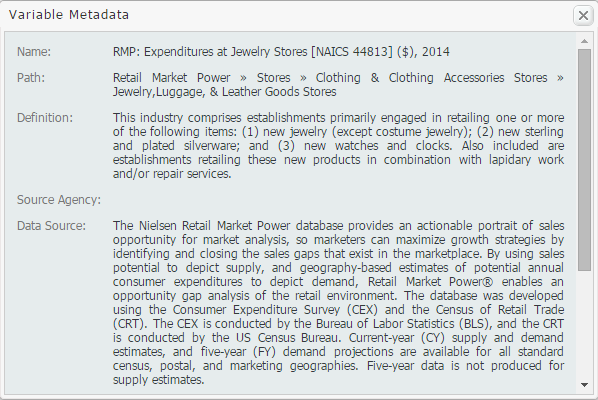
Scenario: You are thinking of opening up a jewelry store in your ZIP code, but first you want to determine if there is a need for one, and discover if people in the area readily buy jewelery.
Solution: First, open a Standard Report and use your ZIP code as the location. Next, navigate through the Retail market Power category in the Variables menu to find jewelry store expenditures and sales in your location. After selecting the correct variables, close out the Variables menu to generate your report.

 The report is shown below:

According to the above results, there is a fairly large gap in the jewelry store industry in the 44146 ZIP code where expenditures are greatly exceeding sales. Many residents must be spending their money at jewelry stores outside of the ZIP code, creating an opportunity for more jewelry stores to site locally.
The above scenario is a brief look at this dataset. Explore the other 17 category folders and let us know some interesting figures you come across!
Lastly, don’t forget to enter into our Winter Sweepstakes where we’ll be giving away an iPad and Kindle Fire! Details here: Winter Sweepstakes!
More from SimplyAnalytics
Posted on Apr 10, 2015 by Admin
In this week’s SimplyMap report, we explore one of the newer datasets available: Retail Market Power®. What is it? In short, the Retail Market Power® dataset helps users identify opportun...
Posted on Jan 24, 2009 by Admin
Men's Health magazine took a look this month at where our wireless habits are most out of control. Their methodology includes the use of SimplyMap: First, we crunched data from SimplyMap...
Posted on Dec 02, 2014 by Admin
Today we take a look at one of the more advanced features in SimplyMap - editing the map legend. Editing the map legend is a great way to not only customize how the data is distributed on...
Posted on Sep 05, 2019 by Admin
SimplyAnalytics will be exhibiting at the biennial North Carolina Library Association conference, to be held this year at the Winston-Salem Benton Convention Center. If you are attending,...
Posted on Mar 21, 2018 by Admin
The Quick Report is one of the newest features added to SimplyAnalytics - let’s take a look at how it can support your research. This report instantly provides you with a curated list of ...
Posted on Jul 20, 2020 by Admin
Hello readers! We hope you are doing well and staying safe. Today we are excited to introduce the Simmons NCS crosstabs functionality! This is a feature we’ve been working on for a while,...
Posted on Jul 28, 2013 by Admin
We recently discovered some interesting data on participation and attitudes towards recycling, and decided to dig a bit deeper into our Experian SimmonsLOCAL data. This data package inclu...
Posted on Jul 09, 2009 by Admin
The American Library Association 2009 Annual Conference will take place in Chicago, IL from July 9- July 15, 2009 at McCormick Place West located at 2301 S. Lake Shore Drive Chicago, IL. ...
Posted on Feb 26, 2014 by Admin
The Statewide California Electronic Library Consortium is holding another packed week of workshops and networking during the SCELCapalooza event in March 2014. Geographic Research will b...
Posted on Sep 09, 2015 by Admin
This week’s SimplyMap report will set out to discover what America’s favorite type of music is. We will use data within the premium data package, SimmonsLOCAL to answer the question. The ...