 Go up


Visualizing Brand Preference: Athletic Shoes
Posted on Feb 14, 2017 by Admin
In previous blog entries, we highlighted the value of having a mapping application to complement premium data when analyzing America's geographic preferences in credit cards, and mayonnaise brands. This week we’ll take a look at athletic shoe brand preference in the US for adults 18+.
Similar to the previous entries, we will use the SimmonsLOCAL data set to put these maps together. If your institution does not currently subscribe to the SimmonsLOCAL package, feel free to reach out to us about setting up a free 30-day trial. Let’s get started.
The maps below can each be generated in less than a minute! Open up the Variables panel, and find the variables in question at this path: SimmonsLOCAL » APPAREL » SHOES/ FOOTWEAR » SHOES/ FOOTWEAR - BRANDS.
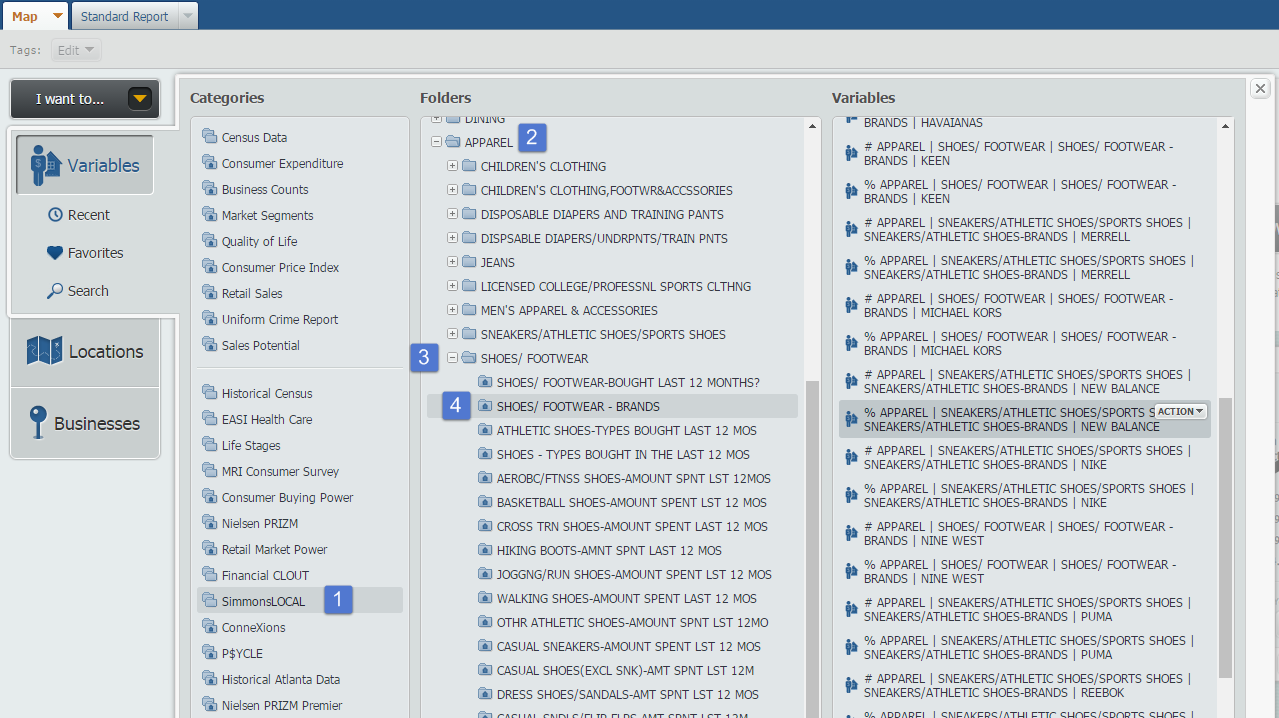
Click on the variable you are interested, and close out the panel to automatically generate a map of the United States. Results for 3 different brands below!
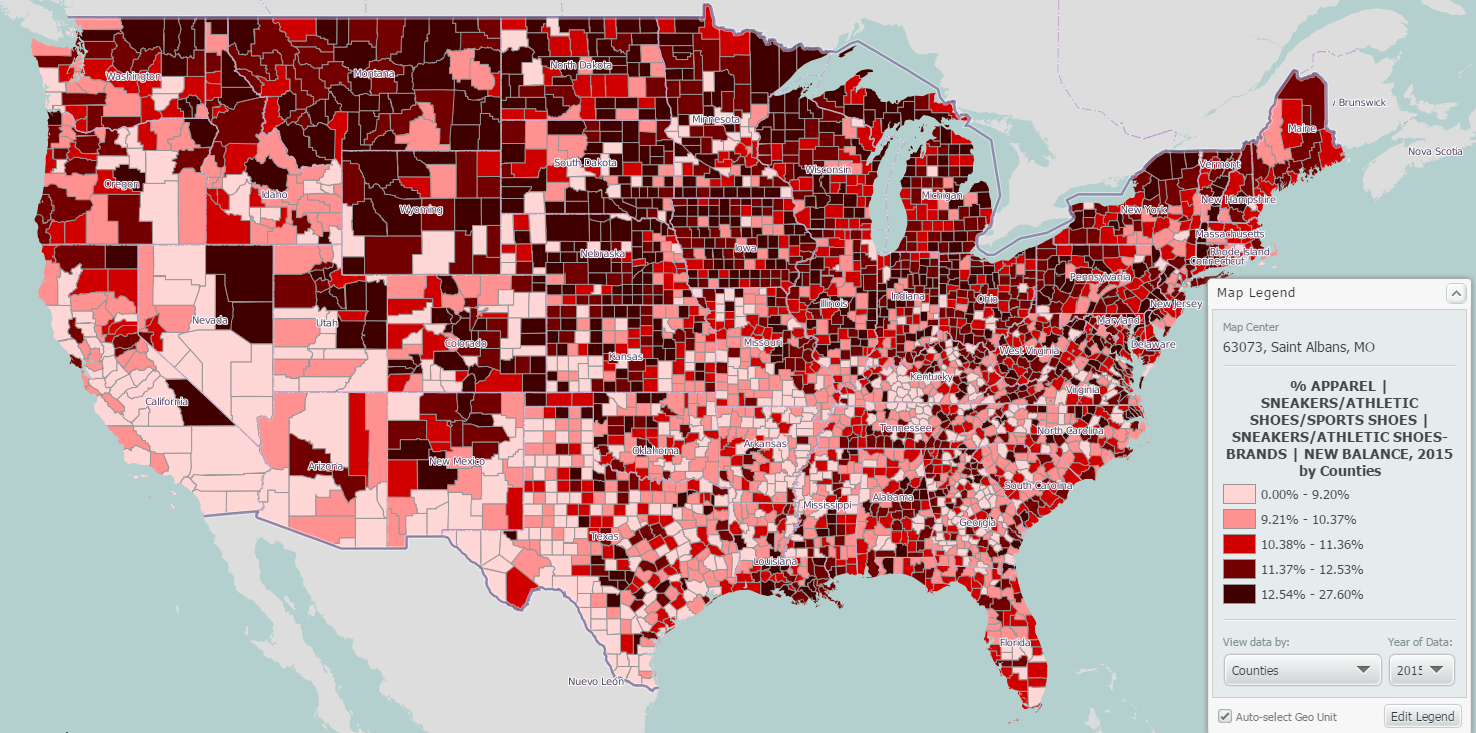
New Balance
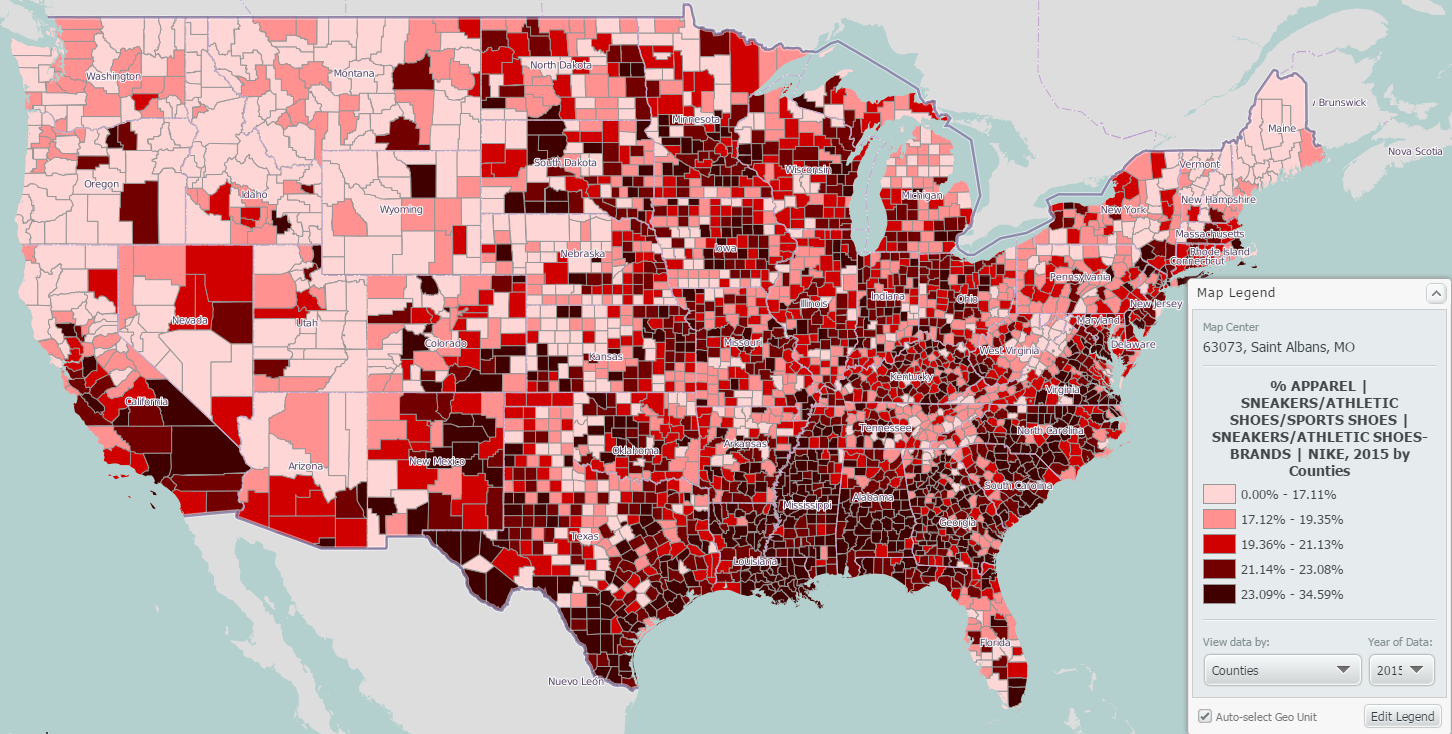
Nike
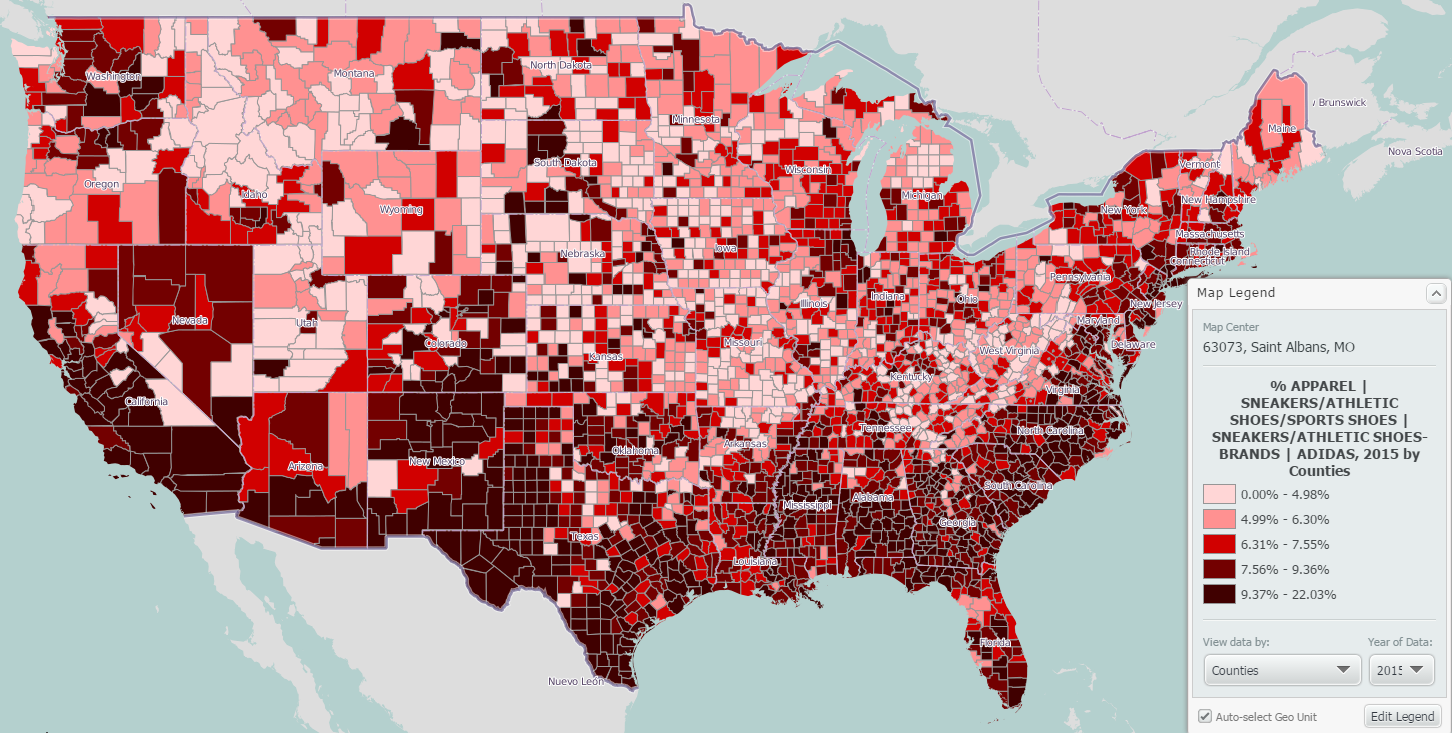
Adidas
A few interesting takeaways from these maps:
1. New Balance is popular amongst the northern half of the US
2. Folks in the south east love their Nikes
3. Adidas dominates the southern portion of the US, including the south west
Can you think of any other brands of items you would like to see mapped? The SimmonsLOCAL data set contains 8,000 specific brands, it is very possible that we have the data you are looking for. Let us know in the comments below!
More from SimplyAnalytics


Posted on Feb 01, 2009 by Admin
Want to know the top 10 wealthiest ZIP codes in your state? How about the top 25 counties with the most elderly residents? Duke University students can now easily answer these questions a...
Posted on Feb 17, 2015 by Admin
Our recent trip to Chicago exhibiting at the ALA Midwinter Meeting inspired this week’s SimplyMap blog post. Today, we’re going to demonstrate how to use business points in SimplyMap to a...
Posted on Sep 27, 2019 by Admin
Hello readers! This week we provide an in-depth response to a question asking about the legend classification methods in SimplyAnalytics. This response is now part of our Help Center: htt...
Posted on Oct 07, 2024 by Admin
We're headed to Charleston! Come visit the SimplyAnalytics team on November 12th at the Gaillard Center at booth 41. We'll be doing live demonstrations of the database, answering question...
Posted on May 26, 2020 by Admin
Hello readers! We hope you are doing well, and thank you for your continued support of SimplyAnalytics. We are excited to announce that scatterplots are officially live! Scatter plots ar...
Posted on Nov 29, 2009 by Admin
The ALA 2010 Midwinter Meeting will be held on January 15-19, 2010 at the Boston Convention and Exhibition Center. (Note that this is not the Hynes Convention Center). Geographic Research...
Posted on May 06, 2013 by Admin
We will be exhibiting at ALA 2013 at McCormick Place in Chicago, IL, June 28-July 1. The ALA Annual Conference programs, updates, conversations, and other events cover all of the key issu...
Posted on Sep 08, 2016 by Admin
One of our favorite uses of SimplyMap is to find data that validates our general assumptions and observations. For example, in a previous blog we wrote about the growth of tablet ownershi...
Posted on Oct 08, 2019 by Admin
Hello readers! This week’s “From the Help Desk” is short & sweet. Let’s get to it! Question: How do I analyze all of the states at once in a report? Answer: The Ranking Report allows ...
Posted on Jun 08, 2015 by Admin
In this week’s report we take a look at one folder found within SimplyMap’s SimmonsLOCAL data package. SimmonsLOCAL is a powerful targeting and profiling system that provides insights int...