 Go up


Exploring SimplyMap Data: Using the Internet to Make Phone Calls
Posted on Sep 08, 2016 by Admin
One of our favorite uses of SimplyMap is to find data that validates our general assumptions and observations. For example, in a previous blog we wrote about the growth of tablet ownership in the US and how the iPad dominates that area. It’s one thing to “know” that tablet ownership has grown, but it’s another thing to view the supporting data behind it.
This week, let’s explore another variable we presume has markedly increased in recent years - the % of Households who used the internet to make a phone call. Let’s get started!
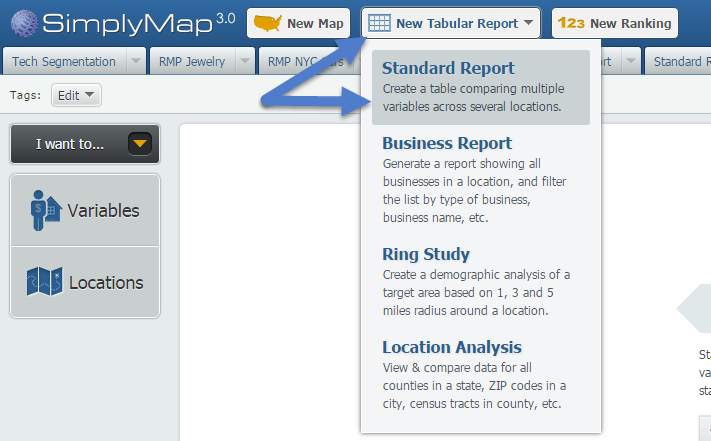
Open up a Standard Report via the New Tabular Report button at the top of SimplyMap:
Navigate through this path: MRI Consumer Survey » Internet » Internet Access and Activities to find the variable, % Households Using - Internet Activities: Made a phone call, 2015.
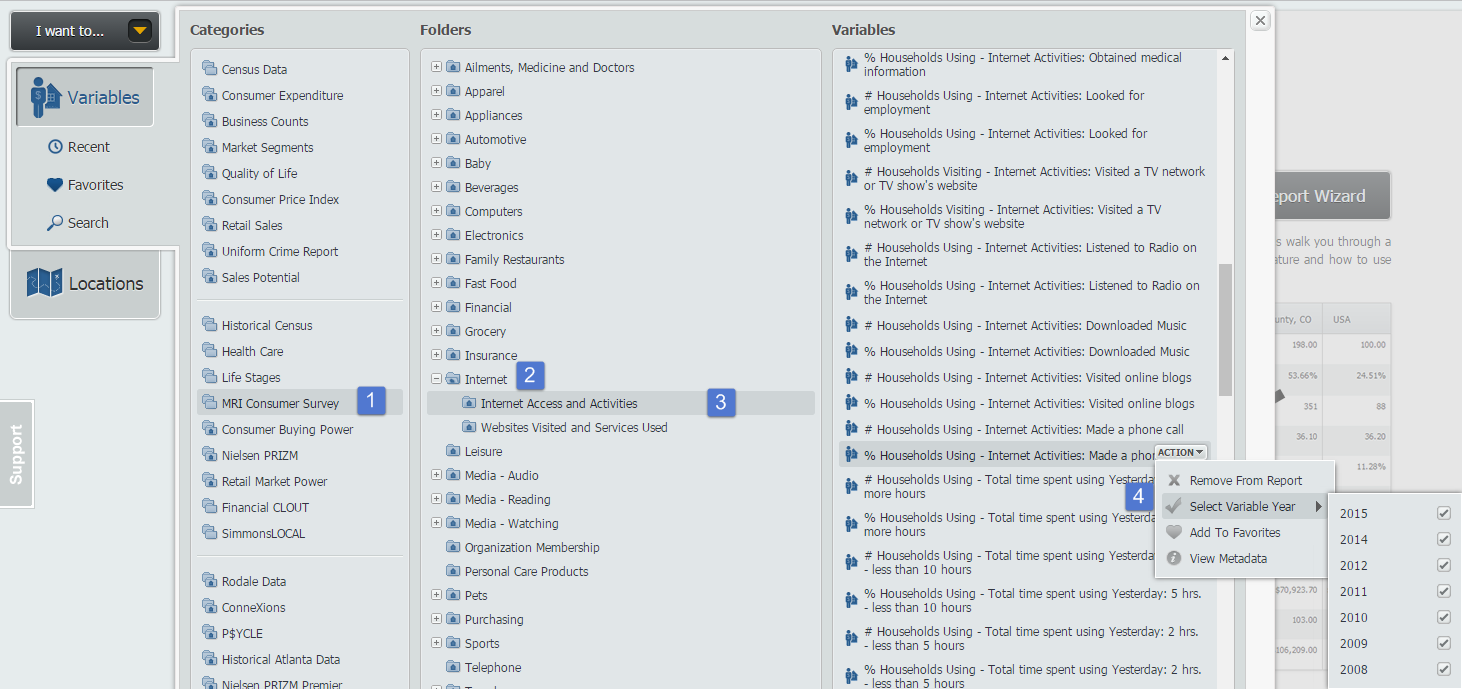
Hover over the Action menu on the variable and select the available years from the Select Variable Year option, shown above.
Close out the Variables panel to generate your report. Results below!
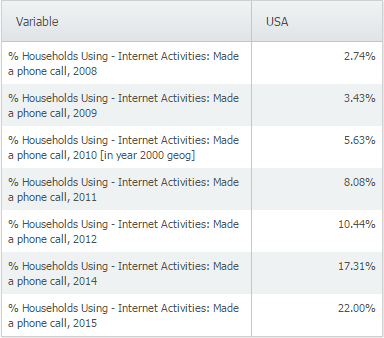
It looks like using the internet to make a phone call has exploded in recent years, from 2.7% in 2008 to 22% in 2015. Why do you think this is? Aside from the availability of the internet in general, it could be due to the rise in tablets, FaceTime and Skype.
Stay tuned for more in this series, and let us know if there’s anything within SimplyMap you’d like to see written about!
More from SimplyAnalytics


Posted on Nov 22, 2016 by Admin
We will be exhibiting at ALA Midwinter in Atlanta, Georgia in January. You can find the GRI team at Booth 1155, where we will be catching up with customers old and new, and sharing some e...
Posted on Dec 15, 2014 by Admin
Custom Locations allow SimplyMap users to combine several locations into one larger region. For example, you can use this feature to combine three adjacent ZIP Codes to create your study ...
Posted on Nov 17, 2014 by Admin
Our recent series Exploring SimplyMap Data Reports has focused on creating ranking reports for unique variables. Accordingly, we thought it would be helpful to write a quick tip on how to...
Posted on Feb 02, 2024 by Admin
We are excited to be back exhibiting at PLA this April in Columbus, OH. Join us at Booth #2631 to discover how SimplyAnalytics can help libraries understand their service area, assist sma...
Posted on May 06, 2013 by Admin
The GRI team is looking forward to exhibiting at SLA 2013 at the San Diego Convention Center, June 9th through the 11th. The Special Libraries Association (SLA) is a nonprofit global orga...
Posted on Nov 11, 2013 by Admin
Chad Boeninger, Business & Economics Subject Specialist at Ohio University Libraries has produced some excellent tutorial videos to help students learn how to analyze data and create ...
Posted on Mar 02, 2018 by Admin
In this week’s blog we’ll take a look at how to enter an address in SimplyAnalytics to find the Census Block Group or Census Tract. Let’s get started! Use Case: You want to analyze the ar...
Posted on Nov 19, 2019 by Admin
Hello readers! Today we are bringing you a new blog entry inspired by a recent Help Desk question. If you ever have any questions about SimplyAnalytics, please do not hesitate to reach ou...
Posted on Oct 24, 2014 by Admin
At times it can be useful to apply filters to the data in SimplyMap as a means of focusing on specific characteristics, or preforming a query. For example, a map showing household income ...
Posted on Jun 02, 2016 by Admin
Three weeks ago we utilized the SimmonsLOCAL data set to visualize contiguous America’s mayonnaise brand preference. Staying with the American visualization theme, this week’s report will...