 Go up


SimplyMap Tip – Creating a Map from a Ranking Report
Posted on Nov 17, 2014 by Admin
Our recent series Exploring SimplyMap Data Reports has focused on creating ranking reports for unique variables. Accordingly, we thought it would be helpful to write a quick tip on how to create a map directly from the ranking results.
After creating a ranking report in SimplyMap, you can quickly create a map using any of the locations in your ranking. Let’s look at an example.
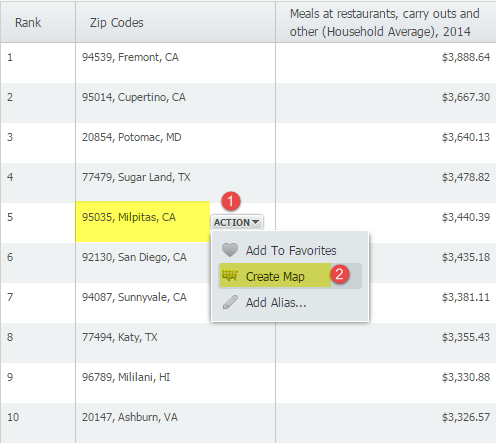
Our November 6 Report, “Which US Locations Dine Out the Most?” identified ZIP code 95035 in Milpitas, CA as the ZIP Code with the highest average spending on restaurant and carry out meals. We can find out exactly where it is located by mapping the location directly from the report by hovering over the location and selecting “Create Map” from the action dropdown, as shown below:
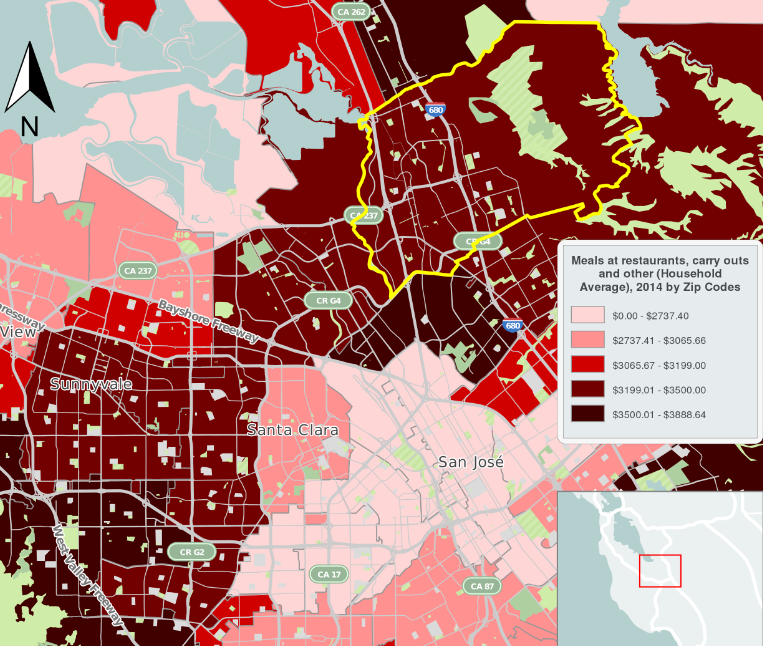
A map using the ranked variable (Meals at restaurants, carry outs and other (Household Average), 2014) will then be created. The image below shows an exported image of ZIP code 95035 in Milpitas, CA.
Stay tuned for more SimplyMap tips and tricks!
More from SimplyAnalytics


Posted on Jun 02, 2017 by Admin
We will be exhibiting at SLA in Phoenix, AZ on June 18th-20th. You can find the SimplyAnalytics team at Booth #905. Stop by and check out our groundbreaking new interface, have a chocolat...
Posted on Oct 23, 2009 by Admin
SimplyMap was highlighted in the Wake County, NC Public Library Business Blog today as a valuable tool for business planning. Wake County has access to SimplyMap through NC LIVE, a statew...
Posted on Jan 08, 2018 by Admin
The SimplyAnalytics team will be exhibiting at ALA Midwinter in Denver February 9-12. Stop by booth 2152 for a visit and a tour of SimplyAnalytics, the best-in-class analytics and data vi...
Posted on Jun 21, 2019 by Admin
Come visit the SimplyAnalytics booth (#3010) at the upcoming ALA 2019 show in Washington, D.C.! Our team will be on hand offering quick demos of SimplyAnalytics, answering questions and s...
Posted on Apr 28, 2016 by Admin
In this week’s SimplyMap report we’ll take a look at one of our newer data packages offered, P$YCLE® by Nielsen. P$YCLE® is a segmentation system that evaluates consumers using key demogr...
Posted on Feb 19, 2016 by Admin
Drop by booth #857 at PLA 2016 to meet the SimplyMap team and learn more about the features and functions behind SimplyMap. Have a Ghirardelli Chocolate while we present SimplyMap and off...
Posted on Mar 18, 2015 by Admin
Can you guess which US city has the most residents per square mile? Today we’re going to use SimplyMap to answer this question for all cities, as well as cities with a population greater ...
Posted on May 23, 2012 by Admin
We will be exhibiting at the Special Libraries Association (SLA) annual conference and Info-Expo at McCormick Place in Chicago Sunday June 15th - Tuesday July 17th. Visit us at Booth 124 ...
Posted on Jun 09, 2021 by Admin
Hello readers! SimplyAnalytics will be exhibiting at the Virtual ALA Annual Conference this year on June 23-26. Be sure to drop by our booth, and click the banner image to video chat with...
Posted on Mar 09, 2010 by Admin
The GRI team will be exhibiting at the 2010 Public Library Association conference later this month at the Oregon Convention Center in Portland, OR. The PLA National Conference is the prem...