 Go up


Visualizing Preferences in SimplyMap: Credit Cards
Posted on Jun 02, 2016 by Admin
Three weeks ago we utilized the SimmonsLOCAL data set to visualize contiguous America’s mayonnaise brand preference. Staying with the American visualization theme, this week’s report will map the US as it relates to the brand of credit card they own.
To create these maps, we tapped into the Nielsen Financial CLOUT data package. Nielsen Financial CLOUT is a database that contains current year (CY) and five year (FY) projections of market penetration and dollar balances for more than 100 financial products. These modeled estimates and projections include all basic banking products and auxiliary services, such as checking accounts and bill pay, and other services, such as investments and retirement accounts.
The four mapped % Households Owning variables can be found at this path in SimplyMap: Financial CLOUT » Credit Card Products » Bank Credit Card Products
American Express Blue/Clear/Co-branded Card
MasterCard
Discover Card
VISA Card
American Express Blue/Clear/Co-branded

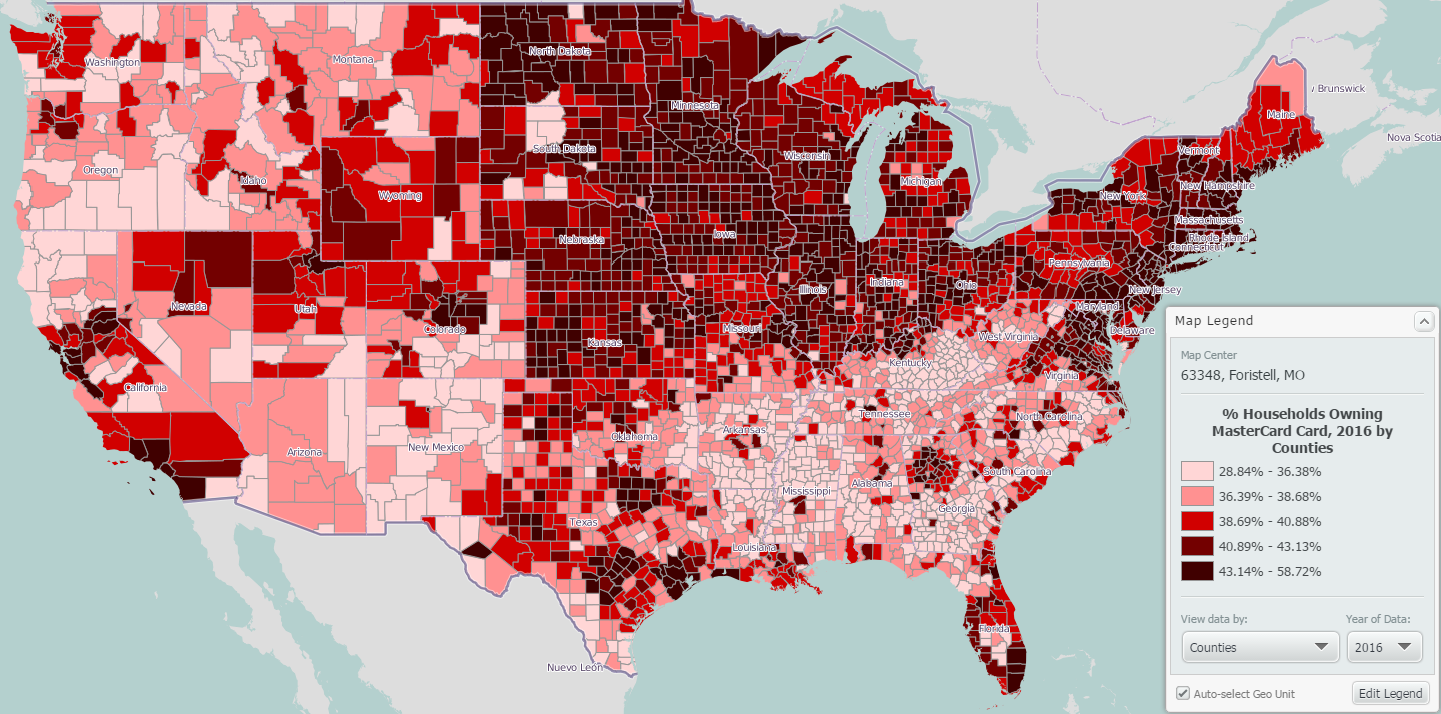
MasterCard
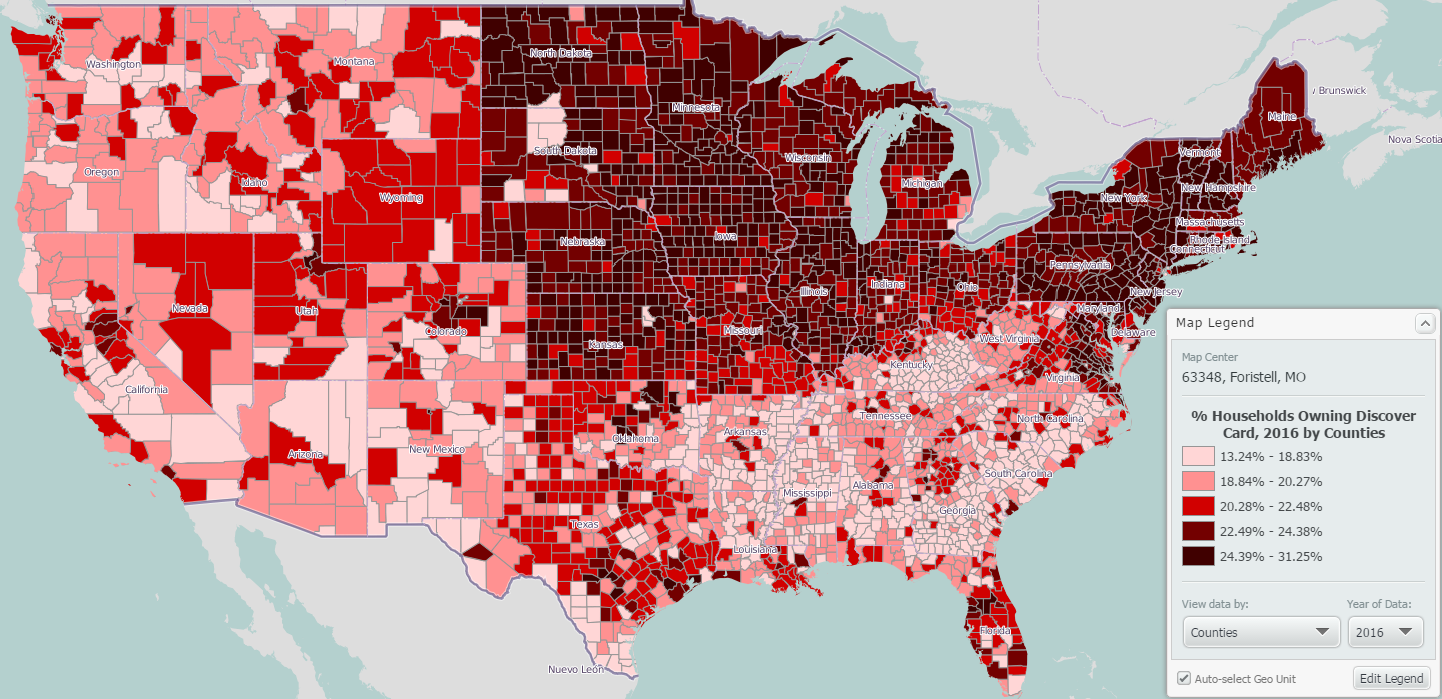
Discover Card
Visa

Some interesting points to note from this data:
1. American Express Blue/Clear, while the least popular card overall has concentrated ownership towards the western US.
2. Visa appears to be the most popular card (using the legend as reference).
3. The rural southern US counties tend to rank among the lowest in credit card ownership.
4. The northeast ranks among the higher counties across all credit cards.
Comparing the data across the US at large reveals the following:
% Households Owning American Express Blue/Clear/Co-branded Card - 14.63%
% Households Owning Discover Card - 21.51%
% Households Owning MasterCard Card - 42.46%
% Households Owning VISA Card - 58.30%
We hope you enjoyed this week’s SimplyMap report - stay tuned for more!
More from SimplyAnalytics


Posted on Jun 25, 2015 by Admin
In this week’s SimplyMap report, we review the different options available when searching for a business. The easiest and fastest method of mapping businesses or creating a business repor...
Posted on May 19, 2016 by Admin
Drop by booth #215 at the SLA 2016 conference to chat with us and get the latest info on SimplyMap. We look forward to seeing our customers, friends, and all others interested in learning...
Posted on Apr 28, 2016 by Admin
In this week’s SimplyMap report we’ll take a look at one of our newer data packages offered, P$YCLE® by Nielsen. P$YCLE® is a segmentation system that evaluates consumers using key demogr...
Posted on Nov 06, 2013 by Admin
SimplyMap includes a number of helpful support tools; guided wizards available when and where you need them, detailed help files, and an online support center with FAQs and searchable kno...
Posted on Sep 05, 2019 by Admin
SimplyAnalytics will be exhibiting at the biennial North Carolina Library Association conference, to be held this year at the Winston-Salem Benton Convention Center. If you are attending,...
Posted on Jan 18, 2008 by Admin
The BRASS Business Reference Sources Committee of Reference & User Services Quarterly (RUSA) selected SimplyMap as one of the Outstanding Business Reference Sources for 2007. Excerpt...
Posted on May 25, 2010 by Admin
We will be exhibiting at the 2010 SLA Annual Conference & INFO-EXPO June 13-15 at the Ernest N. Morial Convention Center in New Orleans, LA. Join us at booth 1537 - bring your quest...
Posted on Sep 10, 2019 by Admin
Hello readers! It’s been a minute since our last tutorial post, but you can expect to see more content on a weekly basis moving forward. “From the Help Desk” is a new feature on the blog ...
Posted on Jul 28, 2013 by Admin
We recently discovered some interesting data on participation and attitudes towards recycling, and decided to dig a bit deeper into our Experian SimmonsLOCAL data. This data package inclu...
Posted on Apr 30, 2008 by Admin
Doreen Harwood, Business Librarian from the University of Washington has developed a series of detailed tutorials on using SimplyMap. The tutorials, which are Flash-based and interactive,...