 Go up


Using SimplyMap to Identify Relationships Between Variables
Posted on Nov 11, 2015 by Admin
Inspired by a recent help desk ticket, we wanted to discuss how users may utilize SimplyMap to identify relationships between unique variables. For example, does having a college degree significantly impact the median income of areas? And how does median income effect spending on eating out? Let’s take a look at ZIP Codes within the state of North Carolina.
To quickly analyze a larger area by its smaller geographies, a Location Analysis Report is ideal.
Click on New Tabular Report > Location Analysis:

Choose the state of North Carolina, and navigate to the variables you would like to see compared and analyzed. In this example, we’ll use:
Household Inc, Median
% Education, College, Master's or Doctorate Degree, 2015
% Education, High School
Food away from home (Household Average)
# Households (HHs)
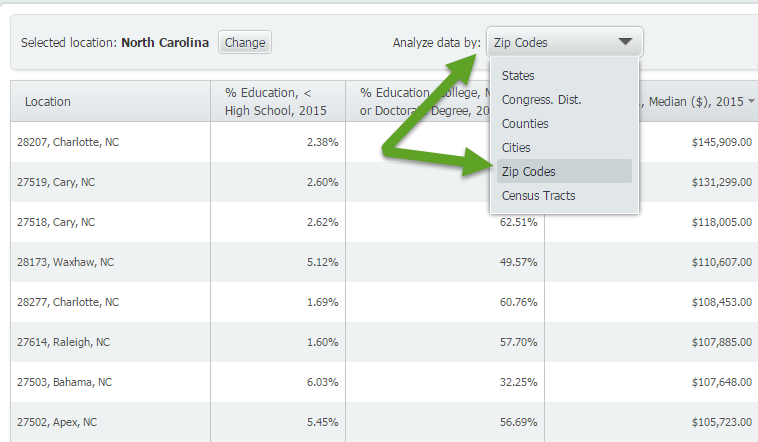
Once you’ve selected your variables, close out the Variables Panel and your report will be created. Be sure to select ZIP Codes from the Analyze Data By option that appears towards the top, shown below.
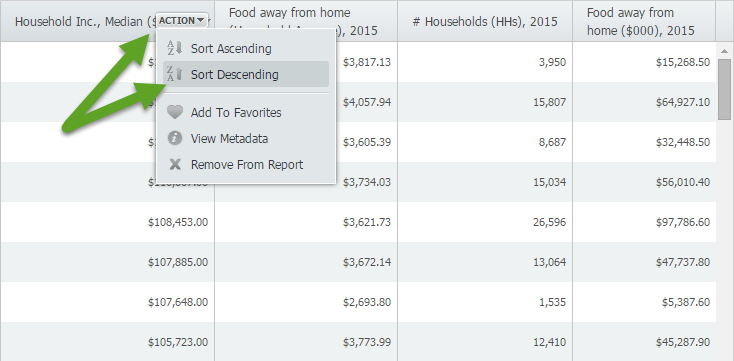
The last step is to choose a variable (column header) and Sort Descending. For example, if you sort descending for Median HH Income, you will get a ranked list (from high to low) of income by Zip Code. Scan the other columns to get a sense of education levels in these locations, and how much they tend to spend eating out.
Sort Descending Income Results:
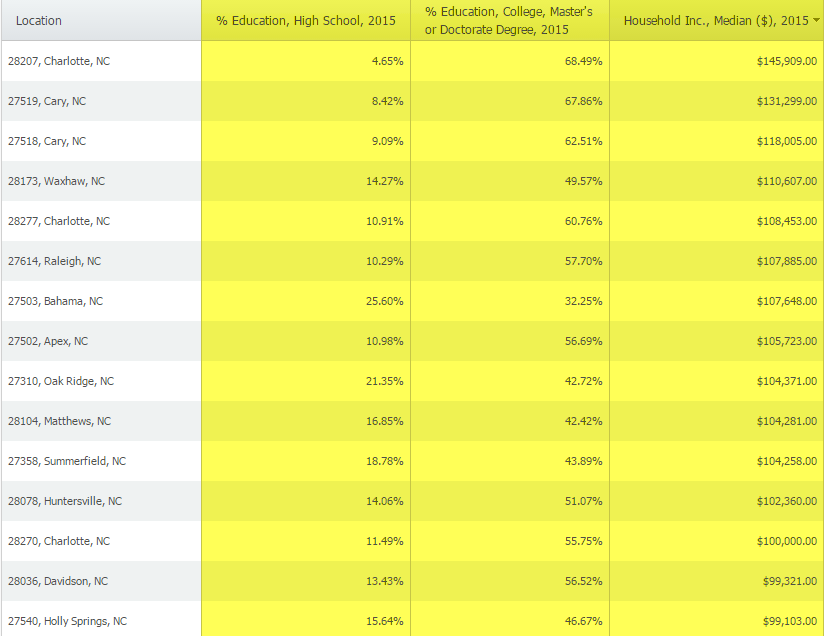
Conclusion: The results yield that higher median income areas tends to also have a higher percentage of residents who have at least a college degree. The money spent eating out was somewhat surprising as results did not vary significantly in lower median income areas (although it did go down and especially in the very low income areas).
Note: You may also want to look at # Households or Population Totals in these areas as the averages and percentages would be impacted by those figures.
These results seem to verify a relationship that’s already well known and somewhat intuitive, however, with more than 60,000 variables in SimplyMap you could study relationships between Median Income and Whiskey Drinking, or Pet Ownership, or Yoga Participation, Transportation to work... the possibilities are endless. We’ll be sure to revisit this same topic in the near future!
More from SimplyAnalytics


Posted on Jun 09, 2016 by Admin
In this week’s blog, we’ll be featuring our newest data offering, PRIZM® Premier. If your institution currently subscribes to PRIZM data, this new module is available at no additional cos...
Posted on Sep 20, 2019 by Admin
Hello readers! Today we have a brief update for you on what’s new in SimplyAnalytics. Since the release of the Quick Report feature a few months ago, we have been asked to make this repor...
Posted on Sep 18, 2015 by Admin
With tens of thousands of variables available in SimplyMap, it’s common for users to wonder whether or not a particular variable they have in mind is available in SimplyMap. This is where...
Posted on Nov 23, 2012 by Admin
Men's Health magazine is charting vanity in US cities, with help from SimplyMap. What did they find? The Sunshine State, with a long history of going to great lengths to look good, tops t...
Posted on Dec 30, 2009 by Admin
Skokie Public Library, in Skokie, IL has published a useful overview of SimplyMap on the Mike's Space blog on SkokieNet. The article is filled with examples of research questions that can...
Posted on Dec 06, 2009 by Admin
ALA's Choice Magazine, publisher of independent reviews of products and services for academic libraries, released a new review of SimplyMap in the December 2009 edition. The reviewer, Car...
Posted on Dec 02, 2014 by Admin
Today we take a look at one of the more advanced features in SimplyMap - editing the map legend. Editing the map legend is a great way to not only customize how the data is distributed on...
Posted on Jun 02, 2017 by Admin
We will be exhibiting at SLA in Phoenix, AZ on June 18th-20th. You can find the SimplyAnalytics team at Booth #905. Stop by and check out our groundbreaking new interface, have a chocolat...
Posted on Oct 26, 2016 by Admin
In this week’s SimplyMap report, we’ll take a look at the tags feature and demonstrate how it can be useful for you as you work in SimplyMap. SimplyMap users can have up to 20 tabs open i...
Posted on May 25, 2010 by Admin
The American Library Association 2010 Annual Conference is coming and the GRI team is gearing up for another great event this summer. We will be in Washington, D.C. again this year, June ...