 Go up


Exploring SimplyMap Data: PRIZM® Premier
Posted on Jun 09, 2016 by Admin
In this week’s blog, we’ll be featuring our newest data offering, PRIZM® Premier. If your institution currently subscribes to PRIZM data, this new module is available at no additional cost.
What is PRIZM® Premier?
Nielsen PRIZM® Premier is the latest evolution of Nielsen’s industry-leading consumer segmentation system. New factors in the PRIZM® Premier model are measures of technology behavior and household assets. The introduction of these key drivers enables you to create segments that reflect how today’s households have embraced technology and how they have weathered the economic shifts in recent years.
PRIZM Premier defines every U.S. household as one of 68 demographic and behavior types, or segments, to help marketers discern those consumers’ likes, dislikes, lifestyles and purchase behaviors. By segmenting consumer households along these lines, you will be better able to reach and retain your most profitable customers and tailor messages and products that resonate with them. PRIZM® Premier data is available for the current year and five-year estimates.
PRIZM Premier in Action
Let’s identify the top segments within a few cities across the United States so we can analyze the segments for each city and how they might differ from one another.
Raleigh, NC
New Orleans, LA
Austin, TX
Miami, FL
To identify top segments requires a simple two step process: first, you need to add all of the PRIZM segment variables to a Standard Report, and secondly you need to sort the respective columns. Let’s get started.
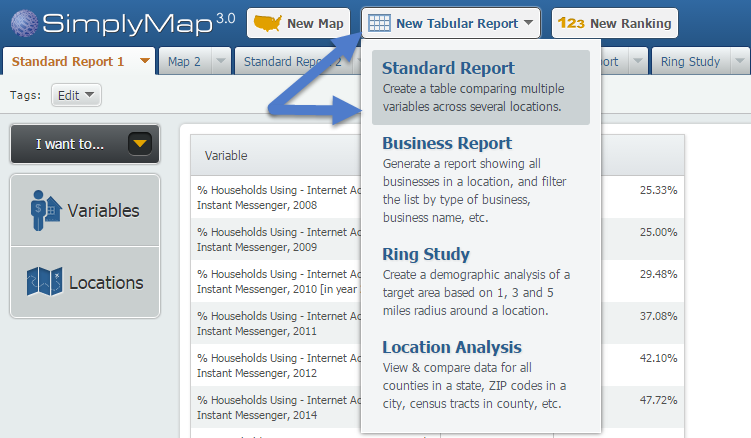
First, select New Tabular Report > Standard Report from the top of SimplyMap.
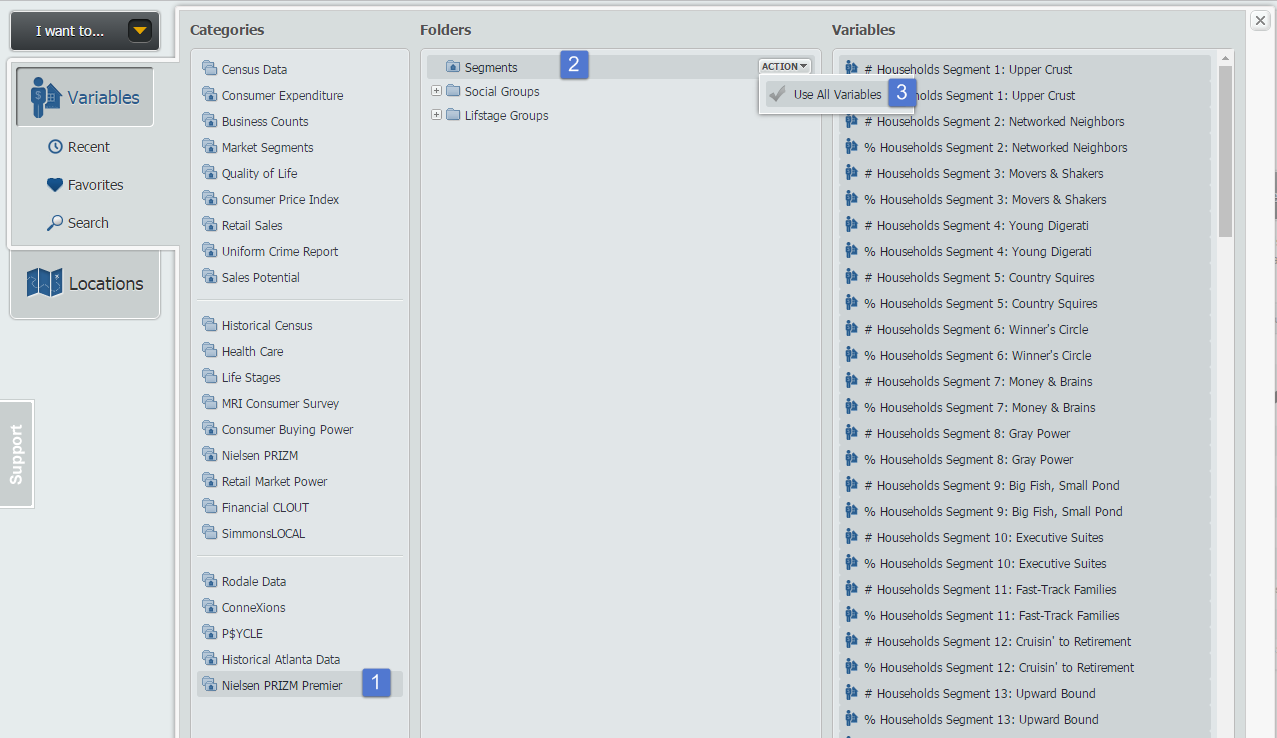
Next, open the Variables panel and navigate to the Nielsen PRIZM® Premier folder. Hover over the Segments folder and select Add All Variables from the Action dropdown that appears. Close out the panel to generate your report for the United States.
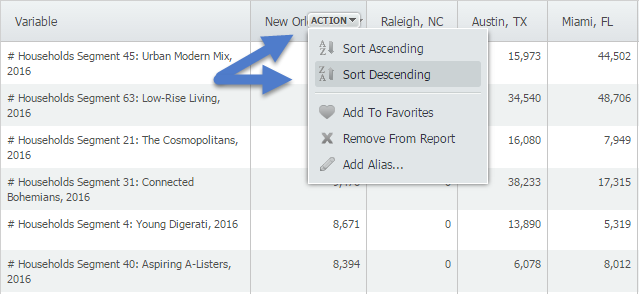
Lastly, click on the Locations panel and begin adding your cities for analysis. To identify the top segment within each city, hover over the location and select Sort Descending - this will bring the top segment numbers to the top, and scrolling further down will also reveal percentages to help normalize the data between cities.
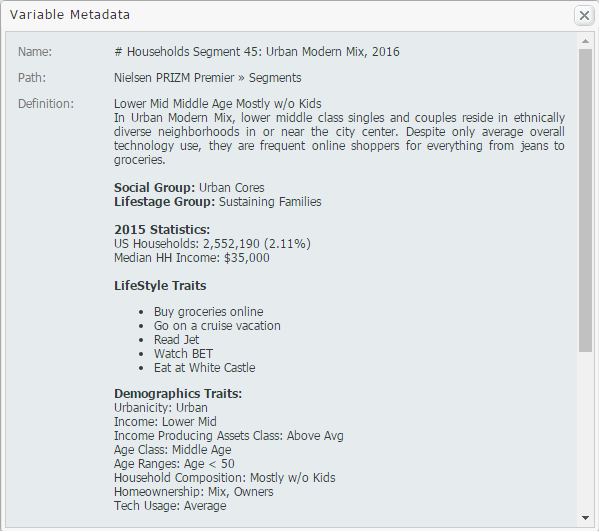
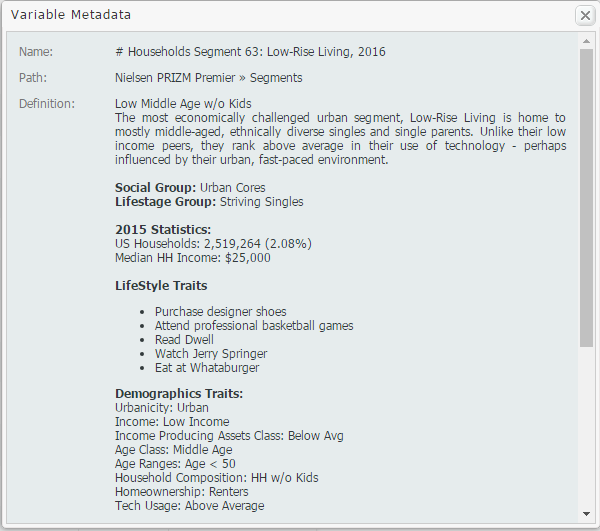
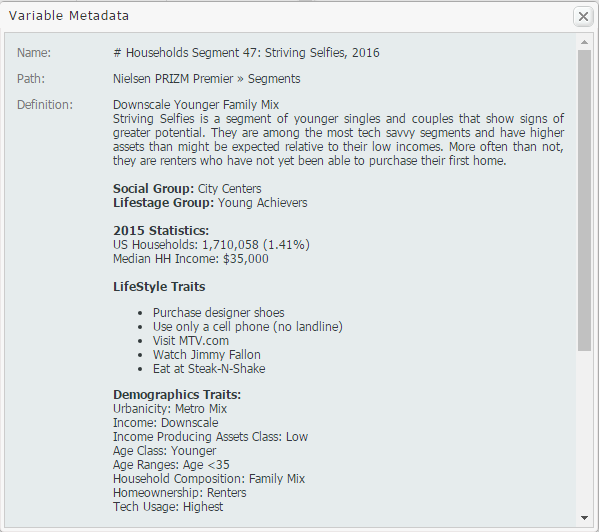
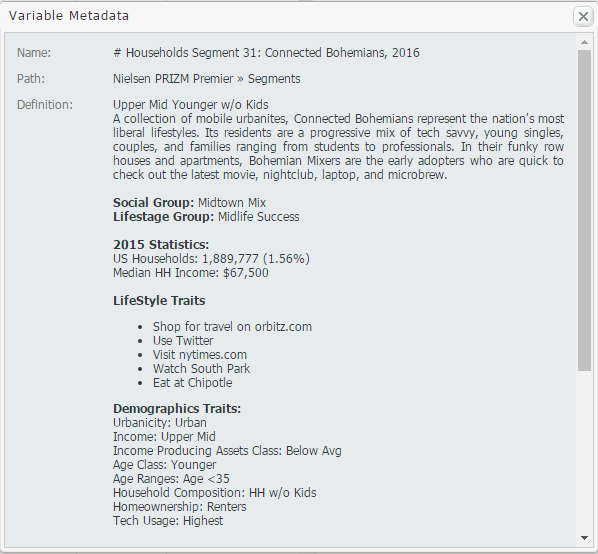
The metadata for each top segment is below! Check it out and let us know what you think.
New Orleans - Segment 45: Urban Modern Mix
Miami - Segment 63: Low-Rise Living
Raleigh - Segment 47: Striving Selfies
Austin - Segment 31: Connected Bohemians
Unique top segments to represent these unique cities in America. We hope you enjoyed this week’s SimplyMap report. Stay tuned for more tips and tricks!
More from SimplyAnalytics


Posted on Jul 26, 2016 by Admin
In this week’s SimplyMap report, we’ll take a look at the Retail Market Power dataset and provide a simple, effective example of how the data package can be used. If your institution curr...
Posted on Nov 11, 2013 by Admin
Chad Boeninger, Business & Economics Subject Specialist at Ohio University Libraries has produced some excellent tutorial videos to help students learn how to analyze data and create ...
Posted on May 26, 2020 by Admin
Hello readers! We hope you are doing well, and thank you for your continued support of SimplyAnalytics. We are excited to announce that scatterplots are officially live! Scatter plots ar...
Posted on Jul 28, 2013 by Admin
We recently discovered some interesting data on participation and attitudes towards recycling, and decided to dig a bit deeper into our Experian SimmonsLOCAL data. This data package inclu...
Posted on Feb 21, 2018 by Admin
We are looking forward to sharing SimplyAnalytics with the public library community at the upcoming PLA 2018 Conference in Philadelphia, PA. Our team will be exhibiting in Booth #855. Vis...
Posted on Feb 02, 2024 by Admin
We are excited to be back exhibiting at PLA this April in Columbus, OH. Join us at Booth #2631 to discover how SimplyAnalytics can help libraries understand their service area, assist sma...
Posted on Jul 22, 2015 by Admin
In this week’s SimplyMap report, we take a look at one of our newly available data packages - ConneXions® from Nielsen. The ConneXions® segmentation system integrates consumer behavior an...
Posted on Sep 05, 2019 by Admin
SimplyAnalytics will be exhibiting at the biennial North Carolina Library Association conference, to be held this year at the Winston-Salem Benton Convention Center. If you are attending,...
Posted on Apr 17, 2009 by Admin
The Special Libraries Association will hold its Annual Conference in Washington, DC at the Washington Walter E. Washington Convention Center from June 14-17 2009. The conference will crea...
Posted on Feb 24, 2019 by Admin
We will be exhibiting at SCELC* Vendor Day on March 14th. Visit us at table 510 and attend one of our two sessions demonstrating SimplyAnalytics. The presentations will highlight newly av...