 Go up


Exploring SimplyMap Data: America’s Historic Homes
Posted on Jan 07, 2015 by Admin
In this week’s exploration of SimplyMap data, we set out to find which cities in the United States have the highest percentage of older houses. To determine this, we used the variable “% Housing, Built 1939 or Earlier”. The metadata for this variable is shown below:
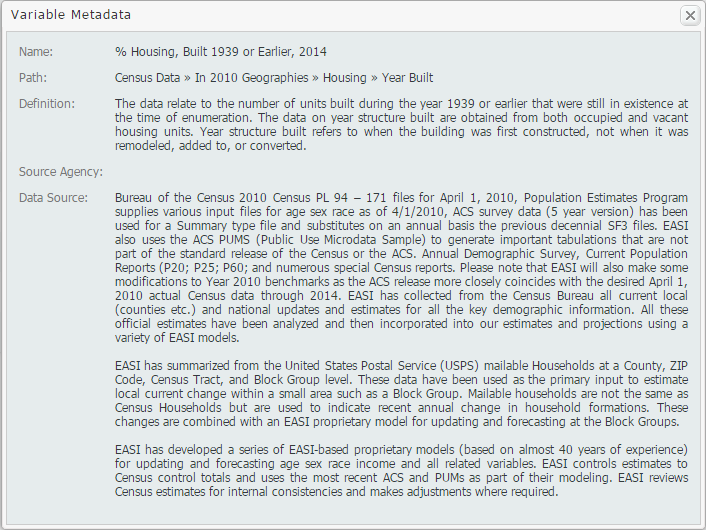
The ranking report allows SimplyMap users to analyze the data by different geographies. For example, if you select the United States as your location, you may rank the data by: USA, States, Congressional Districts, Counties, Cities, ZIP Codes, and Census Tracts.

First, we’ll take a look at the top 10 states. For reference, 12.71% of all of the housing stock in the USA was built before 1939.
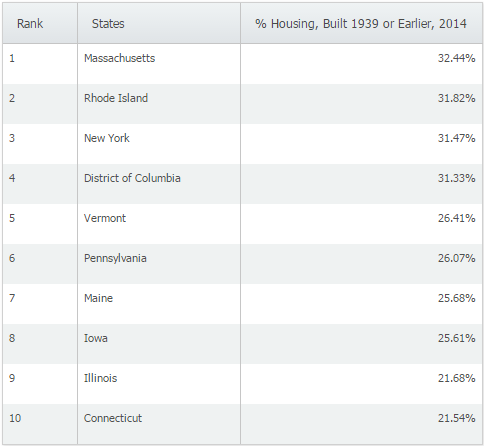
Not surprisingly, the majority of the states with the highest percentage of older homes are located in the northeast. When we switched to cities and applied a population filter > 50,000 we were left with the following cities:
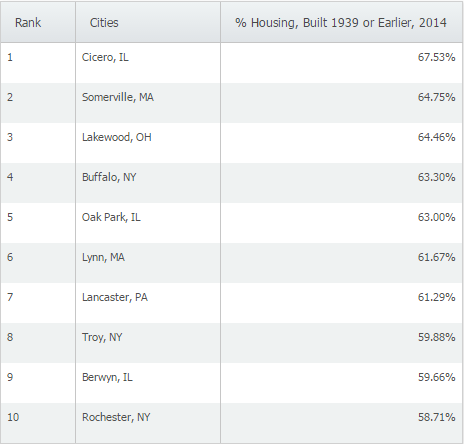
At 67.53% of homes built in 1939 or earlier, Cicero, IL ranks first among cities with populations greater than 50,000 in the United States. We then used the feature to make a map directly from the results page by hovering over Cicero, IL and selecting “Create Map” from the action drop down.
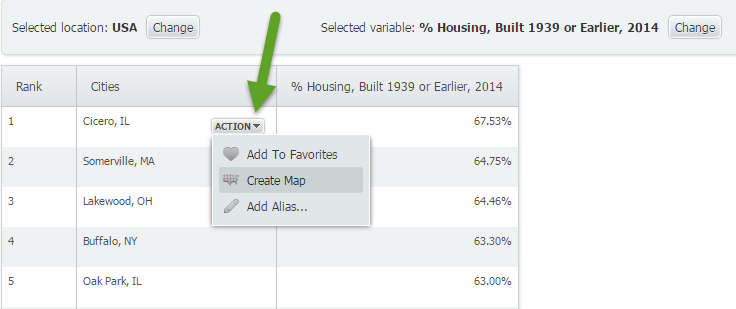
It looks like Cicero, IL is located about 10 miles west from the heart of Chicago.

Want more tips and examples of SimplyMap reports? Follow us on Twitter and like us on Facebook to stay informed!
More from SimplyAnalytics


Posted on Jul 09, 2015 by Admin
In this week’s SimplyMap report, we set out to find which cities have the highest percentages of people who use their bike as their mode of transportation to work in the US. Let’s get sta...
Posted on Mar 30, 2016 by Admin
In previous blog entries we highlighted the usefulness of viewing multiple years of data for the same variable. In short, analyzing the same variable across multiple years allows users to...
Posted on Jul 30, 2008 by Admin
Cornell’s Albert R. Mann Library has subscribed to SimplyMap. They provide some tips and access to the SimplyMap Quick Reference Guide, variable list, and some information on the EASI dat...
Posted on Sep 07, 2011 by Admin
Geographic Research will be exhibiting and presenting during a vendor showcase session at the upcoming North Carolina Library Association (NCLA) Biennial Conference, October 4-7, 2011 in ...
Posted on Aug 13, 2015 by Admin
In this quick SimplyMap report, we use Census data to help us identify which city in the United States has the highest percentage of residents who reported walking to work as their mode o...
Posted on Sep 18, 2015 by Admin
With tens of thousands of variables available in SimplyMap, it’s common for users to wonder whether or not a particular variable they have in mind is available in SimplyMap. This is where...
Posted on Dec 08, 2017 by Admin
Good afternoon, readers! This week we’re going to talk about project management in SimplyAnalytics and how to best take advantage of it. Why are projects needed? Many users have multiple...
Posted on Apr 28, 2016 by Admin
In this week’s SimplyMap report we’ll take a look at one of our newer data packages offered, P$YCLE® by Nielsen. P$YCLE® is a segmentation system that evaluates consumers using key demogr...
Posted on Oct 08, 2008 by Admin
Geographic Research, Inc. (GRI) is pleased to sponsor the fourth annual American Collegiate Retailing Association’s Undergraduate Student Retail Analysis Competition. This is the second ...
Posted on Jan 05, 2018 by Admin
The SimplyAnalytics team is looking forward to exhibiting at the Ontario Library Association Super Conference 2018! Stop by the SimplyAnalytcs booth (115T) and take a look at our newest o...