 Go up


The Landline Telephone’s Descent
Posted on Mar 30, 2016 by Admin
In previous blog entries we highlighted the usefulness of viewing multiple years of data for the same variable. In short, analyzing the same variable across multiple years allows users to identify trends. For example, in one of the previous blogs we showcased the explosion of tablet ownership over recent years (quadrupling!).For this week’s blog, we’ll see if the data matches our own observations on the rapid decline of landline phones in households. Let’s get started!
First, open a Standard Report and navigate through this path: MRI Consumer Survey » Telephone to find the variable, % Households w/ a Telephone: Have a landline telephone, 2015.
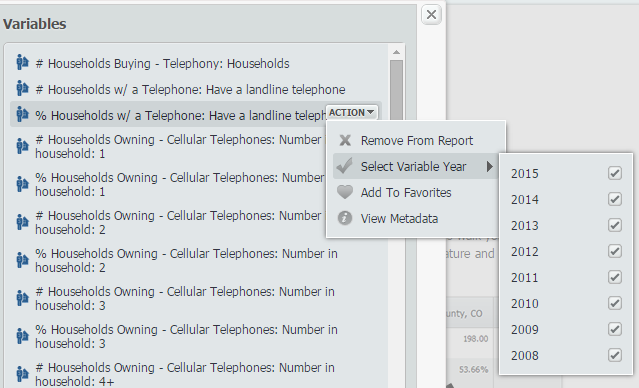
Hover over the variable and select the Select Variable Year option from the Action Dropdown menu. You will see the years 2008-2015 on your screen. Select each year as shown below:
Close out the variables panel to generate your report for the United States. Here are the results:
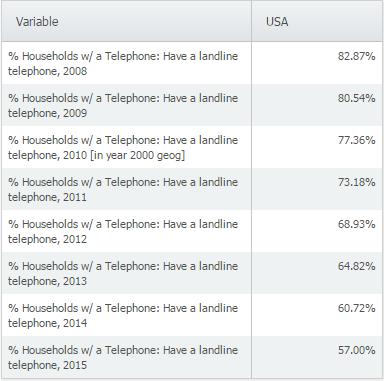
The percentage of households with a landline telephone has dropped significantly, from 82.87% in 2008 to 57% in 2015. We suspect this decrease is due in part to the rise in cell phones among other things, but we’ll leave that data to another blog.
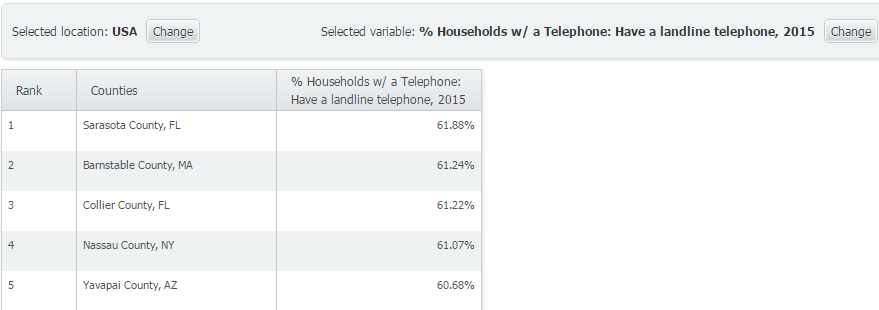
Out of curiosity, we ran a Ranking Report to determine the top 5 counties in America with the highest % of households having a landline telephone:
Note: We applied a population filter of > 200,000.
We hope you enjoyed this week’s SimplyMap report - stay tuned for more!
More from SimplyAnalytics


Posted on Sep 09, 2015 by Admin
This week’s SimplyMap report will set out to discover what America’s favorite type of music is. We will use data within the premium data package, SimmonsLOCAL to answer the question. The ...
Posted on May 19, 2016 by Admin
Drop by booth #215 at the SLA 2016 conference to chat with us and get the latest info on SimplyMap. We look forward to seeing our customers, friends, and all others interested in learning...
Posted on Nov 06, 2019 by Admin
Hello readers! We hope you’re having a wonderful week. Today we feature another entry from our From the Help Desk series. Let’s get started! Question: How do I analyze data for downtown? ...
Posted on Jan 12, 2020 by Admin
Happy New Year! SimplyAnalytics will be exhibiting at the ALA Midwinter meeting, held this year at the Pennsylvania Convention Center in Philadelphia on January 24th-27th. If you attend, ...
Posted on Apr 17, 2018 by Admin
The SimplyAnalytics team would like to congratulate Rachel Holder, MLS candidate at Indiana University for being selected as this year's recipient of the BRASS Student Travel Award! ...
Posted on Mar 02, 2009 by Admin
ACRL's 14th National Conference will be held at the Washington State Trade and Convention Center in downtown Seattle, March 12-15, 2009. Every other year, ACRL offers its premier profe...
Posted on Mar 04, 2014 by Admin
March 11-15 Indianapolis, Indiana The Public Library Association is prepared for another week of events, workshops and special appearances for librarians and authors. Visit our exh...
Posted on Feb 27, 2015 by Admin
SimplyMap is an excellent tool for market research, and it’s made even more powerful by Nielsen PRIZM data. Nielsen PRIZM is the highest quality market segment data available. Every house...
Posted on Jun 09, 2016 by Admin
In this week’s blog, we’ll be featuring our newest data offering, PRIZM® Premier. If your institution currently subscribes to PRIZM data, this new module is available at no additional cos...