 Go up


Identifying Top PRIZM Segments
Posted on Feb 27, 2015 by Admin
SimplyMap is an excellent tool for market research, and it’s made even more powerful by Nielsen PRIZM data. Nielsen PRIZM is the highest quality market segment data available. Every household in the United States is assigned to one of 66 segments, and Nielsen provides detailed information about each segment, such as demographic characteristics, shopping habits, financial and technology preferences, media habits, and much more.
PRIZM segments define every U.S. household in terms of 66 demographically and behaviorally distinct types, or "segments," to help marketers discern those consumers’ likes, dislikes, lifestyles and purchase behaviors. Used by thousands of marketers within Fortune 500 companies, PRIZM provides the "common language" for marketing in an increasingly diverse and complex American marketplace.
Let’s start by identifying the largest PRIZM segments in some target locations.
First, create a Standard Report using your target locations. We’ll compare some different ZIP codes within and including the city of Boston, MA. Next, navigate to the PRIZM segments. You will want to select each # segment within that folder. Lastly, close the window to generate your report.
To locate the highest segment within each location, hover over a location and select Sort Descending. SimplyMap will reprocess the report, showing the highest figure at the top for the selected location.
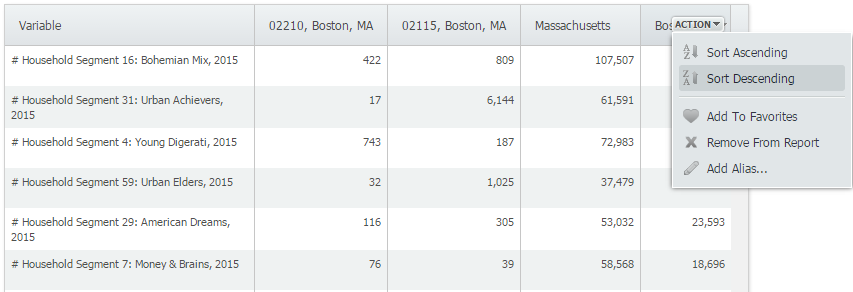 Here are the results for each ZIP code and the city of Boston.
02210: Young Digerati
02115: Urban Achievers
Boston: Bohemian Mix
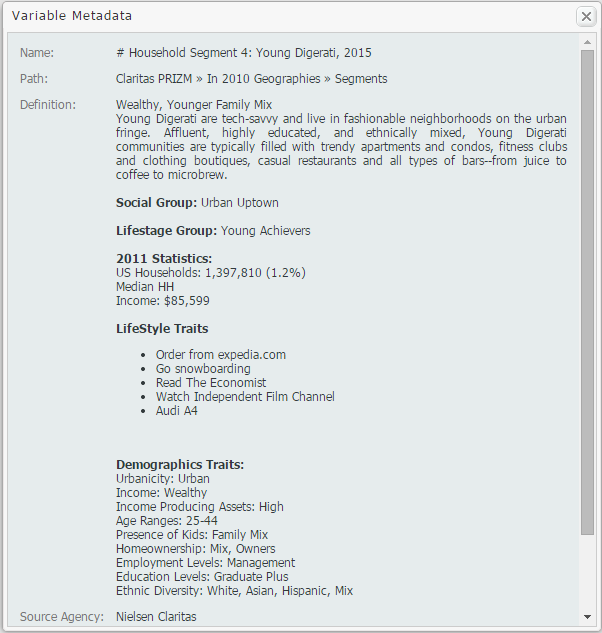
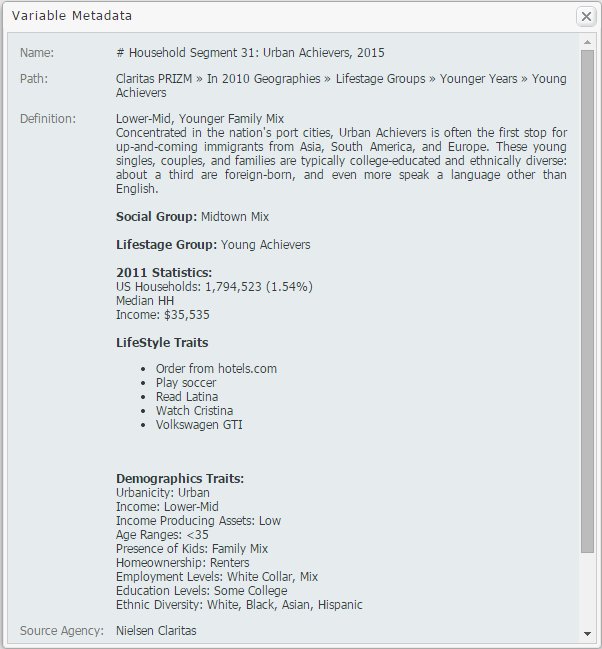
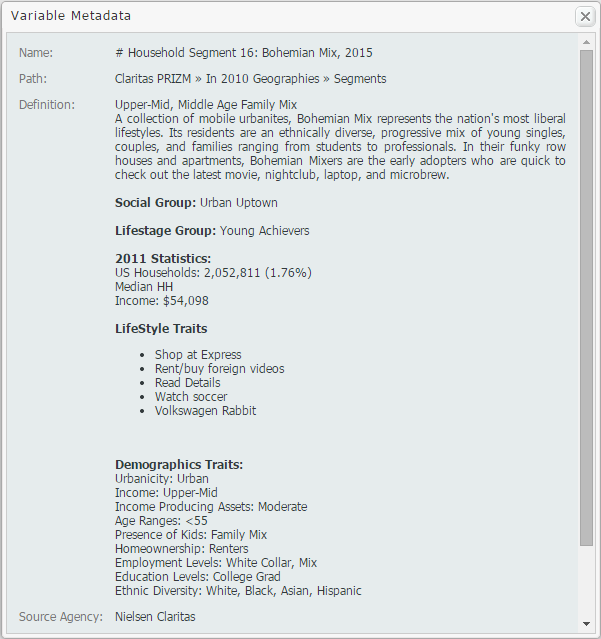
To find out more information about each segment, hover over the segment and select View Metadata. The metadata for each segment above is presented below:
ZIP Code 02210: Young Digerati
ZIP Code 02115: Urban Achievers
Boston, MA: Bohemian Mix Metadata
We hope you enjoyed this week’s blog. Stay tuned for more reports and SimplyMap tips! If you haven’t already, don’t forget to follow us on Twitter and Like Us on Facebook to get yourself entered into our Winter Sweepstakes!
More from SimplyAnalytics


Posted on Jul 30, 2008 by Admin
Cornell’s Albert R. Mann Library has subscribed to SimplyMap. They provide some tips and access to the SimplyMap Quick Reference Guide, variable list, and some information on the EASI dat...
Posted on Jan 10, 2024 by Admin
We are delighted to announce our sponsorship of the Midwest Entrepreneurship Case Competition! At SimplyAnalytics, we understand the power of data-driven decision-making in entrepreneursh...
Posted on Mar 22, 2016 by Admin
Inspired by some recent support desk questions, this week’s SimplyMap report will provide some useful tips and tricks to help make the most out of your maps. Let’s get started! First, let...
Posted on Jul 09, 2015 by Admin
In this week’s SimplyMap report, we set out to find which cities have the highest percentages of people who use their bike as their mode of transportation to work in the US. Let’s get sta...
Posted on Jun 02, 2017 by Admin
We will be exhibiting at SLA in Phoenix, AZ on June 18th-20th. You can find the SimplyAnalytics team at Booth #905. Stop by and check out our groundbreaking new interface, have a chocolat...
Posted on Jun 09, 2021 by Admin
Hello (virtual) ALA attendees! Thank you for dropping by our booth to learn more about SimplyAnalytics. Please email us if you have any questions or would like a live demo or free 30 day ...
Posted on Sep 05, 2019 by Admin
We are pleased to be exhibiting again at the Charleston Library Conference, on Tuesday November 5th, 2019. The Vendor Showcase will be held in the Gaillard Center Grand Ballroom (95 Calho...
Posted on Aug 30, 2009 by Admin
Jeff Zaslow, Wall Street Journal columnist and co-author of the The Last Lecture, will speak at the Orlando, FL Public Library on Friday, September 11 at 7 p.m. Zaslow helped the late Ran...
Posted on Apr 30, 2024 by Admin
Congratulations to Brandyn Whitaker as the recipient of the 2024 BRASS Student Travel Award! Brandyn is a Library Services Associate in the Workforce and Economic Development department a...
Posted on May 17, 2016 by Admin
This week’s SimplyMap report is a quick reader challenge. Can you guess what the map of the United States below is depicting? Keep in mind the legend colors - lighter is less, and darker ...