 Go up


Exploring SimplyMap Data: Walking to Work in the US
Posted on Aug 13, 2015 by Admin
In this quick SimplyMap report, we use Census data to help us identify which city in the United States has the highest percentage of residents who reported walking to work as their mode of transportation. Have any cities in mind? Let’s find out!
First, click New Ranking from the top of your SimplyMap screen.

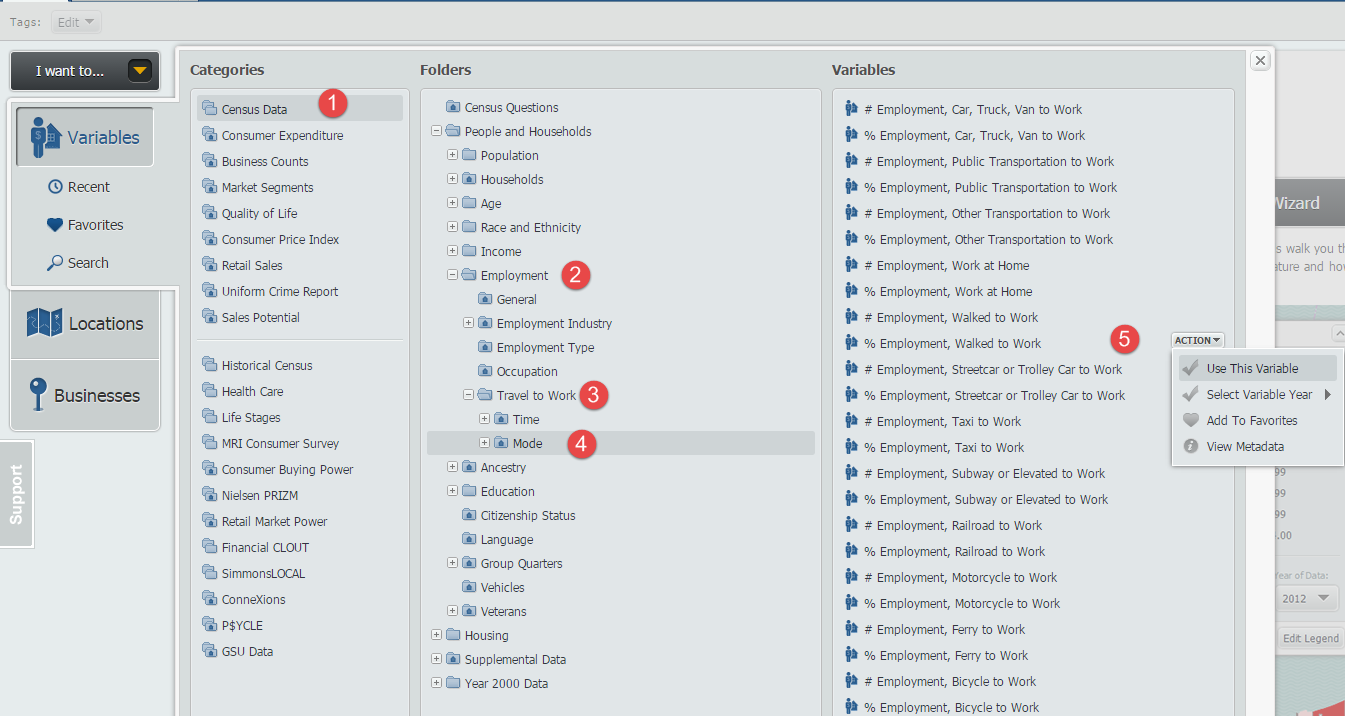
For the variable, follow this path: Census Data » People and Households » Employment » Travel to Work » Mode.
The variable we are looking for is, “% Employment, Walked to Work, 2014”. Picture below for reference.
Click on the Locations panel and select USA as your geography. By default, your report will generate with the Analyze Data By dropdown set to USA. As a good reference point, the USA shows a total of 2.78% of residents who walk to work. Before we analyze the US by city, let’s take a quick look at the US analyzed by top 10 states:

DC coming in with the highest percentage of residents who walk to work, at 12.27%, does not seem too surprising given the relative small land area and highly dense population (over 10,000 people per square mile!). Ranked second, Alaska was surprising to us, and we would be interested in researching more about that - if you know why, feel free to leave a comment below.
Now let’s look at large cities. Switch the Analyze Data By dropdown to Cities and apply a filter to only show cities with a population greater than 100,000. Results are shown below:
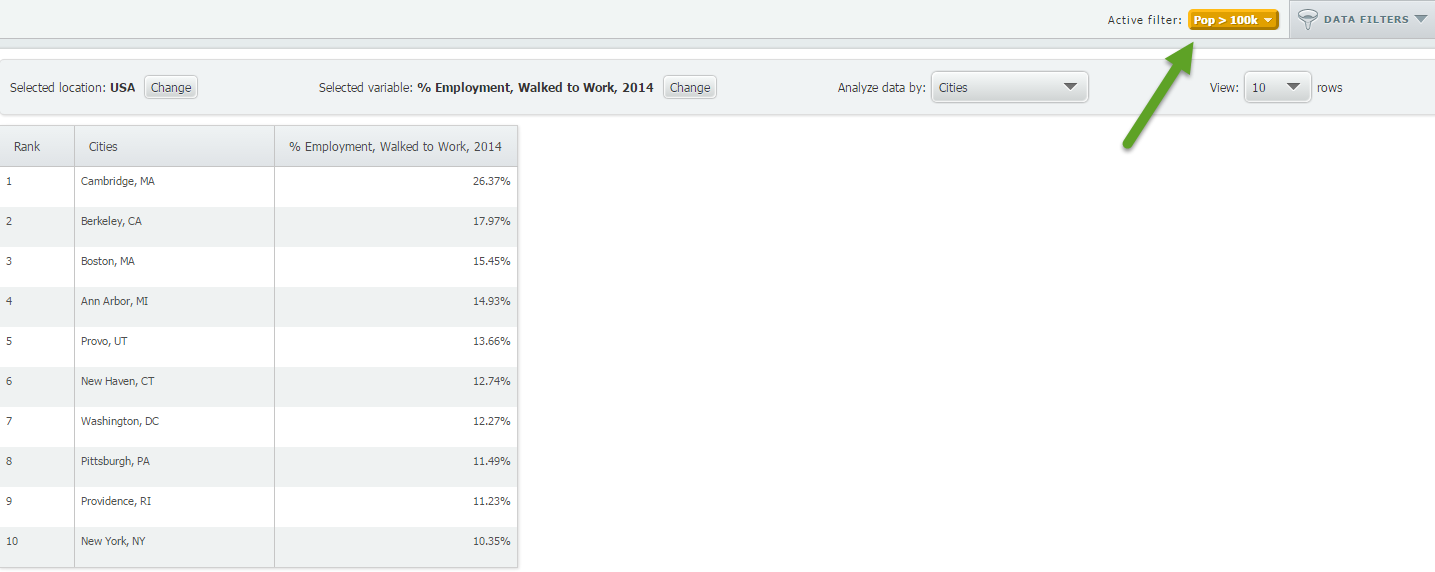
At 26.37%, more than a quarter of Cambridge, MA residents walk to work! We think this might be due to Harvard and MIT being the top employers in the city and within such close proximity to each other.
Honorable mention, and rounding out the top 5:
Berkeley - 17.97%
Boston - 15.45%
Ann Arbor - 14.93%
Provo - 13.66%
That’s it for this week’s SimplyMap report. If there is a particular variable or data package you want to see more of, let us know in the comments below or send us an email or tweet.
More from SimplyAnalytics


Posted on Oct 12, 2010 by Admin
NC LIVE, a member-driven library service organization dedicated to providing online information services that support education, enhance statewide economic development, and increase qu...
Posted on May 17, 2016 by Admin
This week’s SimplyMap report is a quick reader challenge. Can you guess what the map of the United States below is depicting? Keep in mind the legend colors - lighter is less, and darker ...
Posted on Mar 18, 2015 by Admin
Can you guess which US city has the most residents per square mile? Today we’re going to use SimplyMap to answer this question for all cities, as well as cities with a population greater ...
Posted on Apr 21, 2015 by Admin
In this week’s edition of exploring SimplyMap data, we spotlight the Consumer Buying Power® data package in SimplyMap. What is it? The Nielsen Consumer Buying Power® database incorporates...
Posted on Jun 09, 2016 by Admin
In this week’s blog, we’ll be featuring our newest data offering, PRIZM® Premier. If your institution currently subscribes to PRIZM data, this new module is available at no additional cos...
Posted on Feb 24, 2019 by Admin
We will be exhibiting at SCELC* Vendor Day on March 14th. Visit us at table 510 and attend one of our two sessions demonstrating SimplyAnalytics. The presentations will highlight newly av...
Posted on Nov 11, 2013 by Admin
Chad Boeninger, Business & Economics Subject Specialist at Ohio University Libraries has produced some excellent tutorial videos to help students learn how to analyze data and create ...
Posted on Dec 02, 2019 by Admin
Hi everybody! We’re back this week with another question from our Help Desk. This time featuring SimplyAnalytics Canada. Let’s get started! Question: How can I analyze all of the PRIZM5 s...
Posted on Jan 19, 2009 by Admin
The 2009 Midwinter Meeting will be held in Denver, CO, from Jan 23–28, 2009. http://www.ala.org/midwinter The exhibits will be held Jan 23–26, 2009 at the Colorado Convention Center,...
Posted on Nov 04, 2013 by Admin
SimplyMap 3.0 is here, and uses the latest technology to provide better performance, improved reliability, and powerful new features. There are many improvements designed to make it easie...