 Go up


Exploring SimplyMap Data: America’s Bookworms
Posted on Jan 27, 2015 by Admin
In this week’s report exploring SimplyMap data, we take a look at where America’s bookworms reside. To find this data, we used the variable, Reading (Household Average), 2014 found in the Consumer Expenditure folder. This variable encompasses all expenses used on magazine subscriptions, newspaper subscriptions, and books.
To make this report, we chose to utilize a Ranking Report. First, we took a look at the top 10 states:
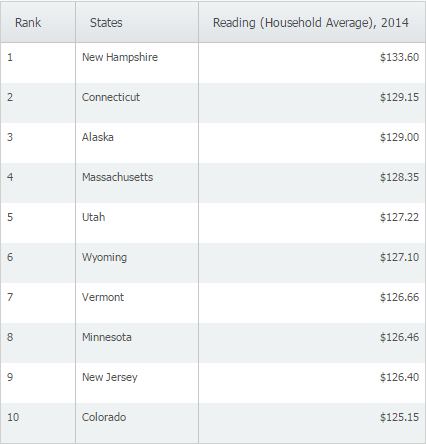
At a yearly household average of $133.60, the state of New Hampshire ranks first in the United States in spending on reading material. For reference, the United States at large totaled $116.85. Next, we applied a data filter to view cities with a population of more than 75,000. The results are as follows:
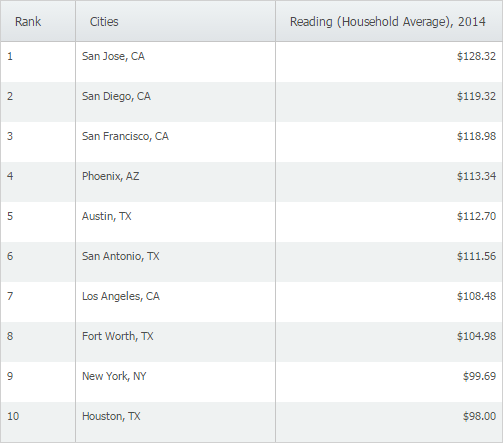
San Jose, CA ranks first in the United States for household spending on reading materials. California is also well represented in the top 10 with San Diego (2), San Francisco (3), and Los Angeles (7) also ranking in the top 10.
Stay tuned for more SimplyMap data reports and tips!
More from SimplyAnalytics


Posted on Nov 03, 2017 by Admin
This week we’ll talk about one of our favorite features in SimplyAnalytics - the custom combination location. This feature is a simple and effective means to create custom geographies whe...
Posted on May 26, 2016 by Admin
In this week’s report exploring SimplyMap data, we take a look at the variables available relative to internet search engines used. The source of this data will come from the SimmonsLOCAL...
Posted on Sep 18, 2015 by Admin
With tens of thousands of variables available in SimplyMap, it’s common for users to wonder whether or not a particular variable they have in mind is available in SimplyMap. This is where...
Posted on Jan 16, 2026 by Admin
We are excited to be exhibiting at the Public Library Association (PLA) 2026 Conference in Minneapolis this April 1-3!
Posted on Nov 11, 2013 by Admin
Chad Boeninger, Business & Economics Subject Specialist at Ohio University Libraries has produced some excellent tutorial videos to help students learn how to analyze data and create ...
Posted on Mar 11, 2024 by Admin
We're thrilled to announce that SimplyAnalytics will be exhibiting at the ALA Annual Conference in San Diego! We can't wait to connect with library professionals, share insights, and show...
Posted on Dec 16, 2015 by Admin
Visit the SimplyMap team at the ALA Midwinter Meeting 2016 in Boston. We will be at booth #1913 offering product demonstrations, tips & tricks, and of course Ghirardelli Chocolate! Ex...
Posted on Sep 10, 2019 by Admin
Hello readers! It’s been a minute since our last tutorial post, but you can expect to see more content on a weekly basis moving forward. “From the Help Desk” is a new feature on the blog ...
Posted on Aug 27, 2018 by Admin
Welcome readers! This week we are excited to feature our newest view in SimplyAnalytics, the Time Series Table.What is it?The Time Series Table allows you to quickly pull all years availa...
Posted on Aug 15, 2013 by Admin
Anyone who has traveled to Seattle hoping for a sunny day could fairly estimate that it is one of the rainiest states with the highest level of precipitation each year. SimmonsLOCAL varia...