 Go up


Exploring SimplyMap Data: Possible Days of Rain
Posted on Aug 15, 2013 by Admin
Anyone who has traveled to Seattle hoping for a sunny day could fairly estimate that it is one of the rainiest states with the highest level of precipitation each year. SimmonsLOCAL variables in SimplyMap include Annual Precipitation data by year, but we can also look at frequency by days of the year. The particular data point shown here represents mean number of days where rain was present out of 365 days, rather than total inches of rain annually.
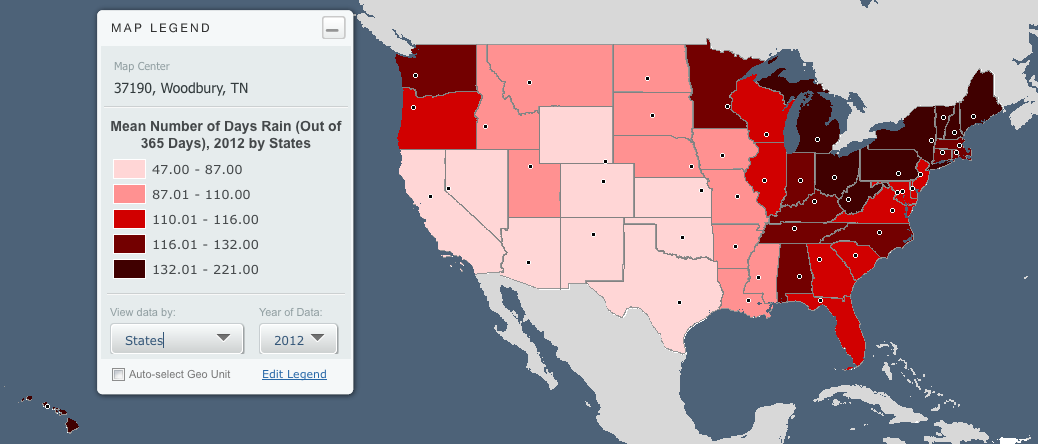
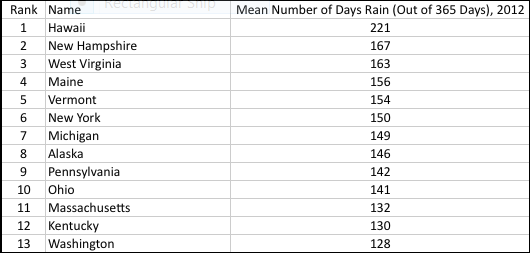
When we first ran this map, we initially overlooked the small state of Hawaii. It wasn’t until we ran a ranking report that we realized it topped the list.
Creating a ranking report with the SimmonsLOCAL “Mean Number Days of Rain” variable, we found that in 2012, there were 221 days of rain in Hawaii compared to Washington with only 128.
To further understand where the rain falls in Hawaii on a map level, we zoomed in for more exact detail by ZIP code.

The ability to quickly toggle between various maps, rankings and reports is helpful for digesting and analyzing the data. Viewing the data in various formats helps the researcher catch nuances in the data and ensure important details are not missed.
More from SimplyAnalytics


Posted on Dec 03, 2015 by Admin
With the Thanksgiving holiday last week, we decided to take a quick look into SimplyMap to see what pertinent variables are available for analysis. First, open the Variables panel and cli...
Posted on Mar 04, 2014 by Admin
March 11-15 Indianapolis, Indiana The Public Library Association is prepared for another week of events, workshops and special appearances for librarians and authors. Visit our exh...
Posted on May 08, 2018 by Admin
We will be exhibiting at the SLA conference in Baltimore, MD this June. Stop by booth #912 and say hello - we look forward to demonstrating SimplyAnalytics, answering your questions, and ...
Posted on May 15, 2015 by Admin
In this week’s SimplyMap report, we want to share with you the many options available when exporting maps in SimplyMap. In SimplyMap, when a user selects Export Map Image from the Actions...
Posted on Apr 28, 2016 by Admin
In this week’s SimplyMap report we’ll take a look at one of our newer data packages offered, P$YCLE® by Nielsen. P$YCLE® is a segmentation system that evaluates consumers using key demogr...
Posted on Feb 25, 2020 by Admin
SimplyAnalytics will be exhibiting at the PLA Conference, held this year at the Music City Center in Nashville, TN on February 26 - 28. Visit the team at Booth 1444 with your questions, f...
Posted on Jul 20, 2020 by Admin
Hello readers! We hope you are doing well and staying safe. Today we are excited to introduce the Simmons NCS crosstabs functionality! This is a feature we’ve been working on for a while,...
Posted on May 06, 2013 by Admin
We will be exhibiting at ALA 2013 at McCormick Place in Chicago, IL, June 28-July 1. The ALA Annual Conference programs, updates, conversations, and other events cover all of the key issu...
Posted on Sep 10, 2010 by Admin
SimplyMap Canada is now available at several Canadian institutions, including York University and Ryerson University, in Toronto. SimplyMap Canada has all of the great features included i...
Posted on Oct 12, 2010 by Admin
NC LIVE, a member-driven library service organization dedicated to providing online information services that support education, enhance statewide economic development, and increase qu...