 Go up


Thanksgiving Data - Macy’s Parade
Posted on Dec 03, 2015 by Admin
With the Thanksgiving holiday last week, we decided to take a quick look into SimplyMap to see what pertinent variables are available for analysis.
First, open the Variables panel and click on Search. Type in “Thanksgiving” in the available box.
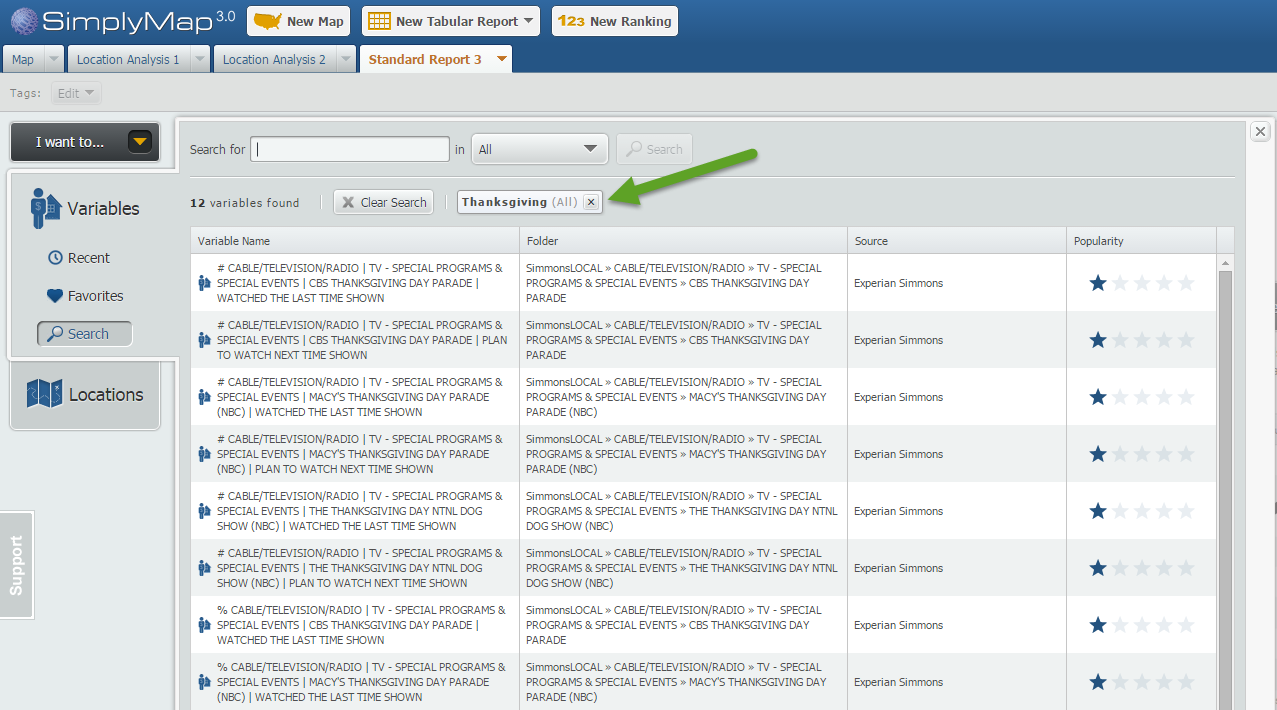
The results display a total of 12 variables related to the keyword ‘Thanksgiving’.For fun, we also searched the keyword: turkey. Care to take a guess how many turkey related variables are in SimplyMap?
If you guessed 122, you’re right! There is a grand total of 122 variables related to the word ‘turkey’, ranging from:
% Households Traveling - Foreign Travel (Including Alaska & Hawaii): Countries or destinations visited: Turkey, 2014
to variables such as:
% Households Using - Chicken & Turkey Fresh Or Frozen: Used in last 6 months, 2014
Interesting! Now returning to our original Thanksgiving search we decided to find out the estimated expected number of viewers for this year’s Macy’s Thanksgiving Parade.
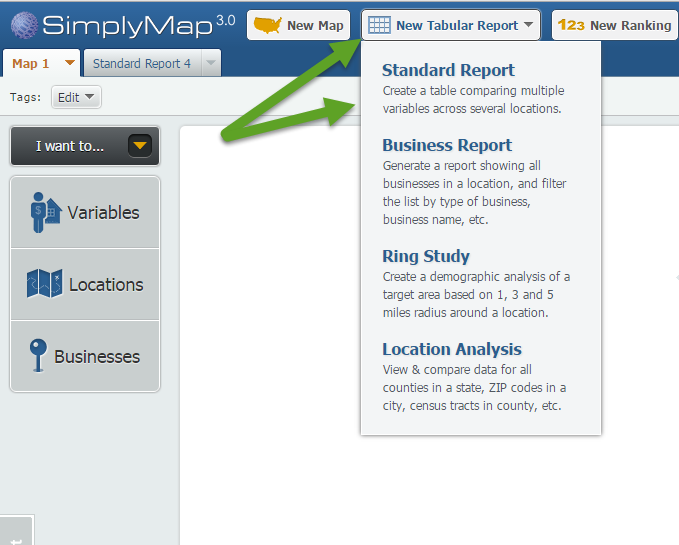
Click on New Tabular Report > Standard Report
The Thanksgiving variables are located in the SimmonsLOCAL folder. The SimmonsLOCAL data set is a premium add on module available for trial or purchase and includes over 60,000 data variables.
Navigate through this path: SimmonsLOCAL » CABLE/TELEVISION/RADIO » TV - SPECIAL PROGRAMS & SPECIAL EVENTS » MACY'S THANKSGIVING DAY PARADE (NBC)
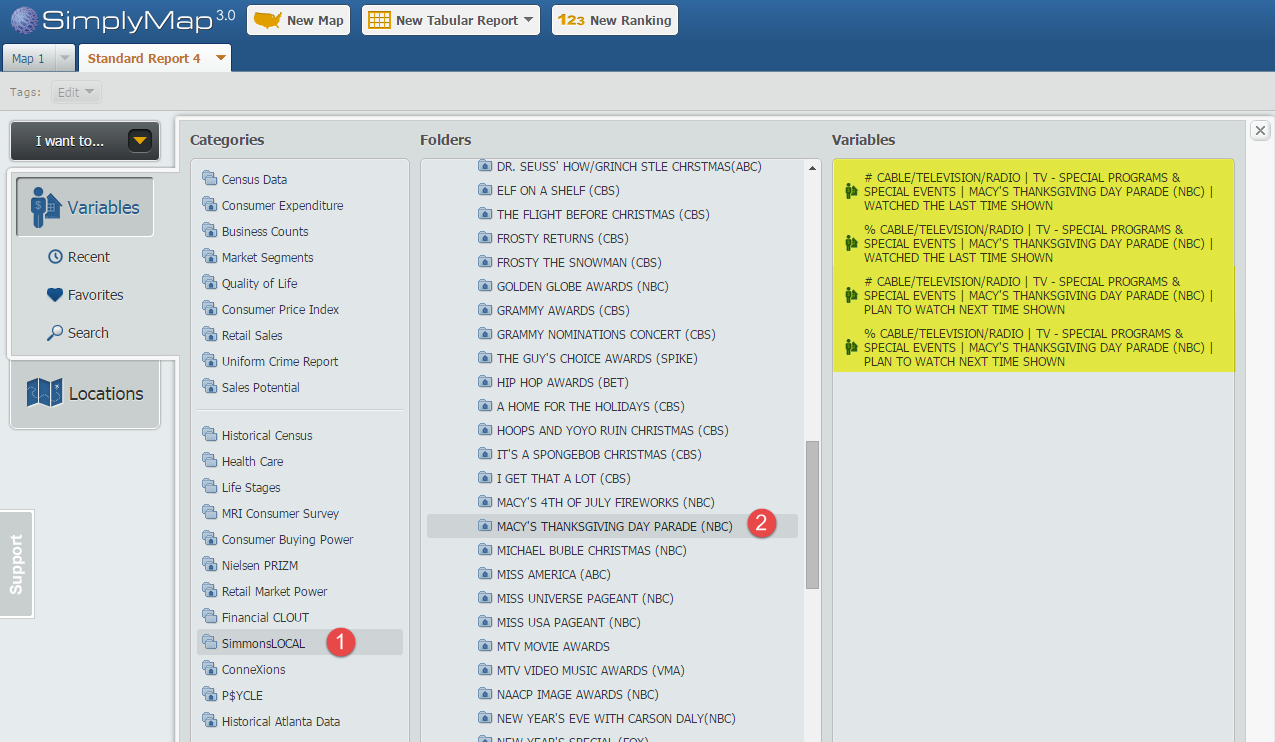
Choose the four variables within the folder, and close out the Variables panel to generate your report for the United States.
Results:
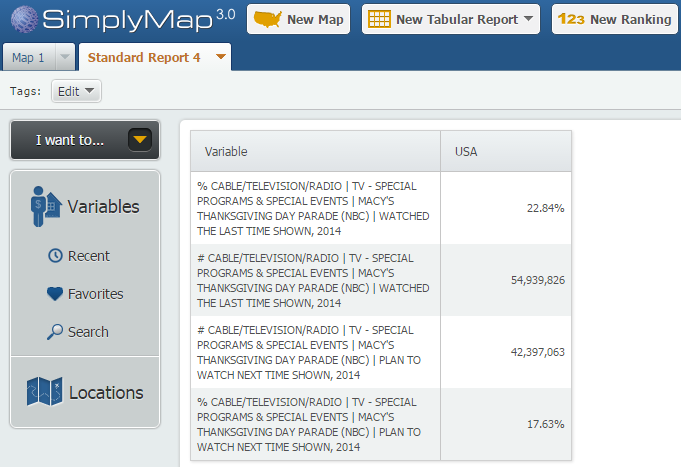
It’s estimated that over 54,000,000 people in the US responded that they had seen the Macy’s Thanksgiving Parade in 2014, with over 42,000,000 responding that they plan to watch the next event!
We hope you enjoyed this week’s report. Stay tuned for more SimplyMap tips and reports.
More from SimplyAnalytics


Posted on Nov 04, 2013 by Admin
SimplyMap 3.0 is here, and uses the latest technology to provide better performance, improved reliability, and powerful new features. There are many improvements designed to make it easie...
Posted on Jul 30, 2008 by Admin
Cornell’s Albert R. Mann Library has subscribed to SimplyMap. They provide some tips and access to the SimplyMap Quick Reference Guide, variable list, and some information on the EASI dat...
Posted on Jan 23, 2024 by Admin
We are excited to again make the trip to Los Angeles for SCELCapalooza 2024 hosted at Loyola Marymount University! Please drop by our table on Wednesday, Feb. 28th to learn more about Sim...
Posted on Nov 24, 2014 by Admin
In this week’s report, we research America’s most educated cities. SimplyMap contains a total of 111 educational attainment variables, including general population and by race. We used th...
Posted on Sep 20, 2019 by Admin
Hello readers! Today we have a brief update for you on what’s new in SimplyAnalytics. Since the release of the Quick Report feature a few months ago, we have been asked to make this repor...
Posted on May 19, 2016 by Admin
Drop by booth #215 at the SLA 2016 conference to chat with us and get the latest info on SimplyMap. We look forward to seeing our customers, friends, and all others interested in learning...
Posted on Oct 27, 2017 by Admin
Welcome to our first ever SimplyAnalytics blog! Every Friday we’ll post a write up on a specific feature or highlight some interesting data in SimplyAnalytics. The goal of these posts is ...
Posted on Mar 04, 2020 by Admin
Come meet the SimplyAnalytics team at the 15th annual Electronic Resources and Libraries conference, held at the AT&T Hotel & Conference Center in Austin, TX. We will be exhibitin...
Posted on May 03, 2011 by Admin
The GRI team is very excited to announce the launch of SimplyMap 2.0! Completely redesigned, it is now easier than ever to access data and create professional quality thematic maps and re...
Posted on Oct 24, 2019 by Admin
Hi everybody! This week we wanted to bring you something unique, so we’re taking you behind the scenes to show you what goes in to setting up the SimplyAnalytics conference booth you’ve c...