 Go up


View Spotlight - Time Series Table
Posted on Aug 27, 2018 by Admin
Welcome readers! This week we are excited to feature our newest view in SimplyAnalytics, the Time Series Table.What is it?The Time Series Table allows you to quickly pull all years available for a variable of your choosing. This allows you to easily identify trends over time.ExampleYou want to track the trend of median household income across some target locations.In your project, select New View towards the top-right of your screen and select Time Series Table.
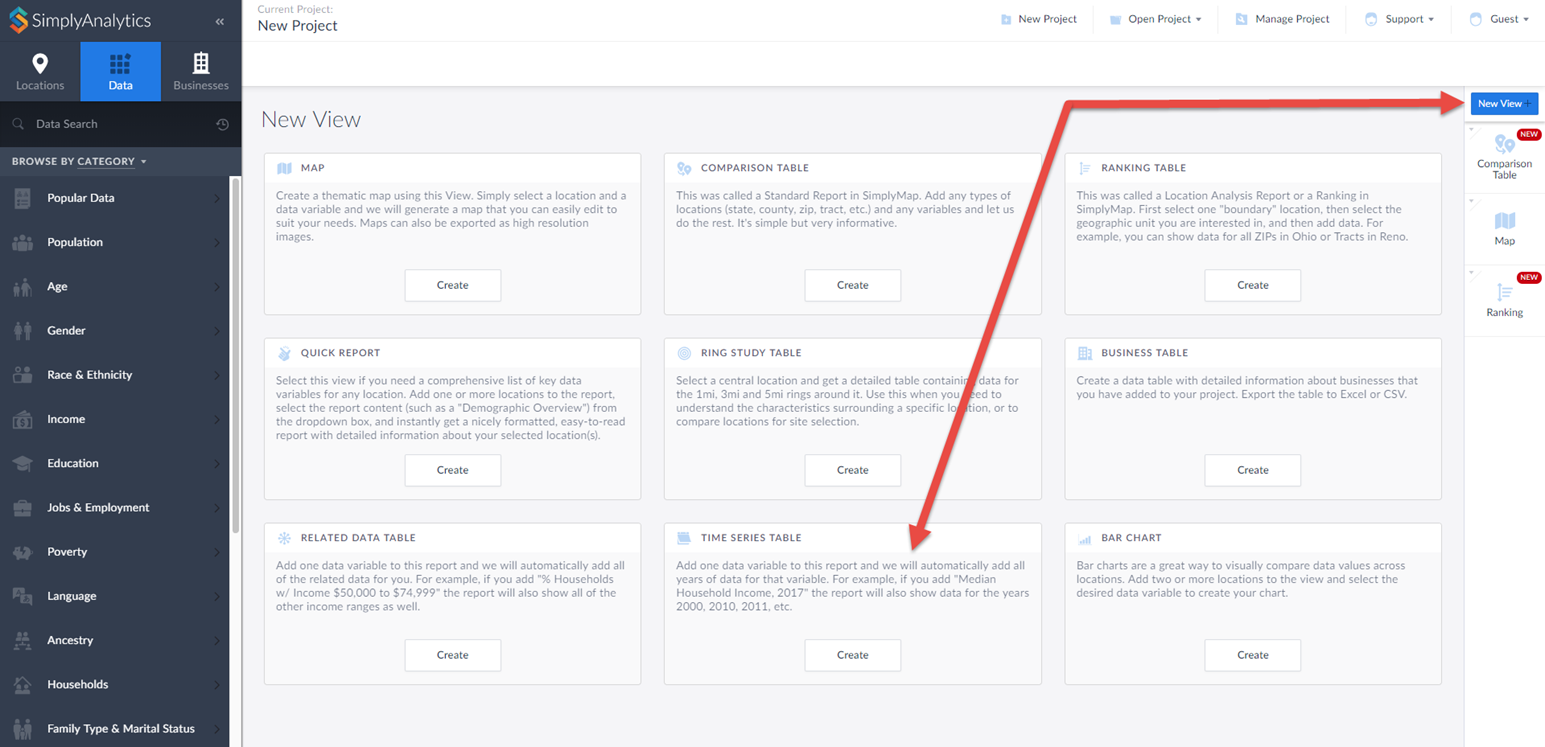
This opens up the Edit View screen. Specify Median Household Income and the locations you want to view the trends for. Click on Done to generate your table.
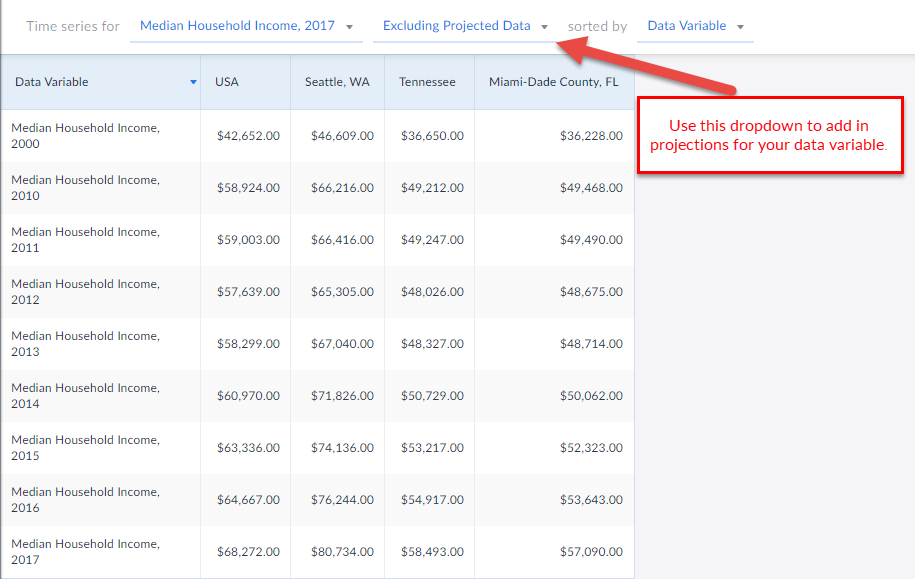
 And that’s all there is to it! You can use the dropdowns to change variables or add in projections for that data variable.
 We hope you’re as excited as we are about this new view - let us know if you have any questions or suggestions for future features or blogs.
More from SimplyAnalytics


Posted on Jun 08, 2015 by Admin
In this week’s report we take a look at one folder found within SimplyMap’s SimmonsLOCAL data package. SimmonsLOCAL is a powerful targeting and profiling system that provides insights int...
Posted on May 06, 2013 by Admin
We will be exhibiting at ALA 2013 at McCormick Place in Chicago, IL, June 28-July 1. The ALA Annual Conference programs, updates, conversations, and other events cover all of the key issu...
Posted on Nov 11, 2015 by Admin
Inspired by a recent help desk ticket, we wanted to discuss how users may utilize SimplyMap to identify relationships between unique variables. For example, does having a college degree s...
Posted on Jan 24, 2009 by Admin
Men's Health magazine took a look this month at where our wireless habits are most out of control. Their methodology includes the use of SimplyMap: First, we crunched data from SimplyMap...
Posted on May 19, 2015 by Admin
We will be attending ALA this summer in San Francisco (hint: dress warm!). Visit us at Booth 413 and don't forget to enter our raffle - we will be giving away a $100 gift certificate to A...
Posted on Feb 27, 2009 by Admin
Geographic Research, Inc. is pleased to participate in the Statewide California Electronic Library Consortium's (SCELC) 12th Annual Vendor Day. SCELC members and librarians from other aca...
Posted on May 31, 2011 by Admin
Kenneth Johnson of the Science, Industry, and Business Library at the New York Public Library recently provided a "boot camp" on the library's market research resources to budding entrep...
Posted on Jun 09, 2016 by Admin
In this week’s blog, we’ll be featuring our newest data offering, PRIZM® Premier. If your institution currently subscribes to PRIZM data, this new module is available at no additional cos...
Posted on Feb 05, 2015 by Admin
Our Winter Sweepstakes has begun! Enter to win an iPad Mini 3 or Kindle Fire. How to Enter: Follow @SimplyMap on Twitter Like our SimplyMap Facebook Page for a 2nd Chance to Win If you ...
Posted on Jan 28, 2010 by Admin
Come visit the Geographic Research booth at the Ontario Library Association Super Conference, February 24-27, 2010 at the Metro Toronto Convention Centre. The Ontario Library Association ...