 Go up


COVID-19 Data is Now Available in SimplyAnalytics
Posted on Apr 07, 2020 by Admin
As COVID-19 spreads across the United States researchers need access to the latest data visualization and analytics tools. As a result, the SimplyAnalytics team just added COVID-19 data at the national, state, and county levels to SimplyAnalytics. The data is from USAFacts.org and we update it daily with the latest numbers.
The following data variables are now available in SimplyAnalytics:
- Confirmed COVID-19 Cases by date
- Prevalence of confirmed COVID-19 cases (per 100,000 individuals) by date
- Deaths from COVID-19 by date
- Prevalence of deaths from COVID-19 (per 100,000 individuals) by date
You can find the COVID-19 data in SimplyAnalytics in two places:
- [recommended] Go to the Data tab, click on the "Data Folder" view (located just below the data search box), then scroll to the bottom of the list of data folders, or
- Go to the Data tab, click on the Health category icon, then check the box next to COVID-19 in the list of health sub-categories
This data can be combined with our demographic and health data variables to identify areas with vulnerable residents, such as the elderly, people with respiratory illnesses, and smokers.
Here are the best ways to view this data in SimplyAnalytics:
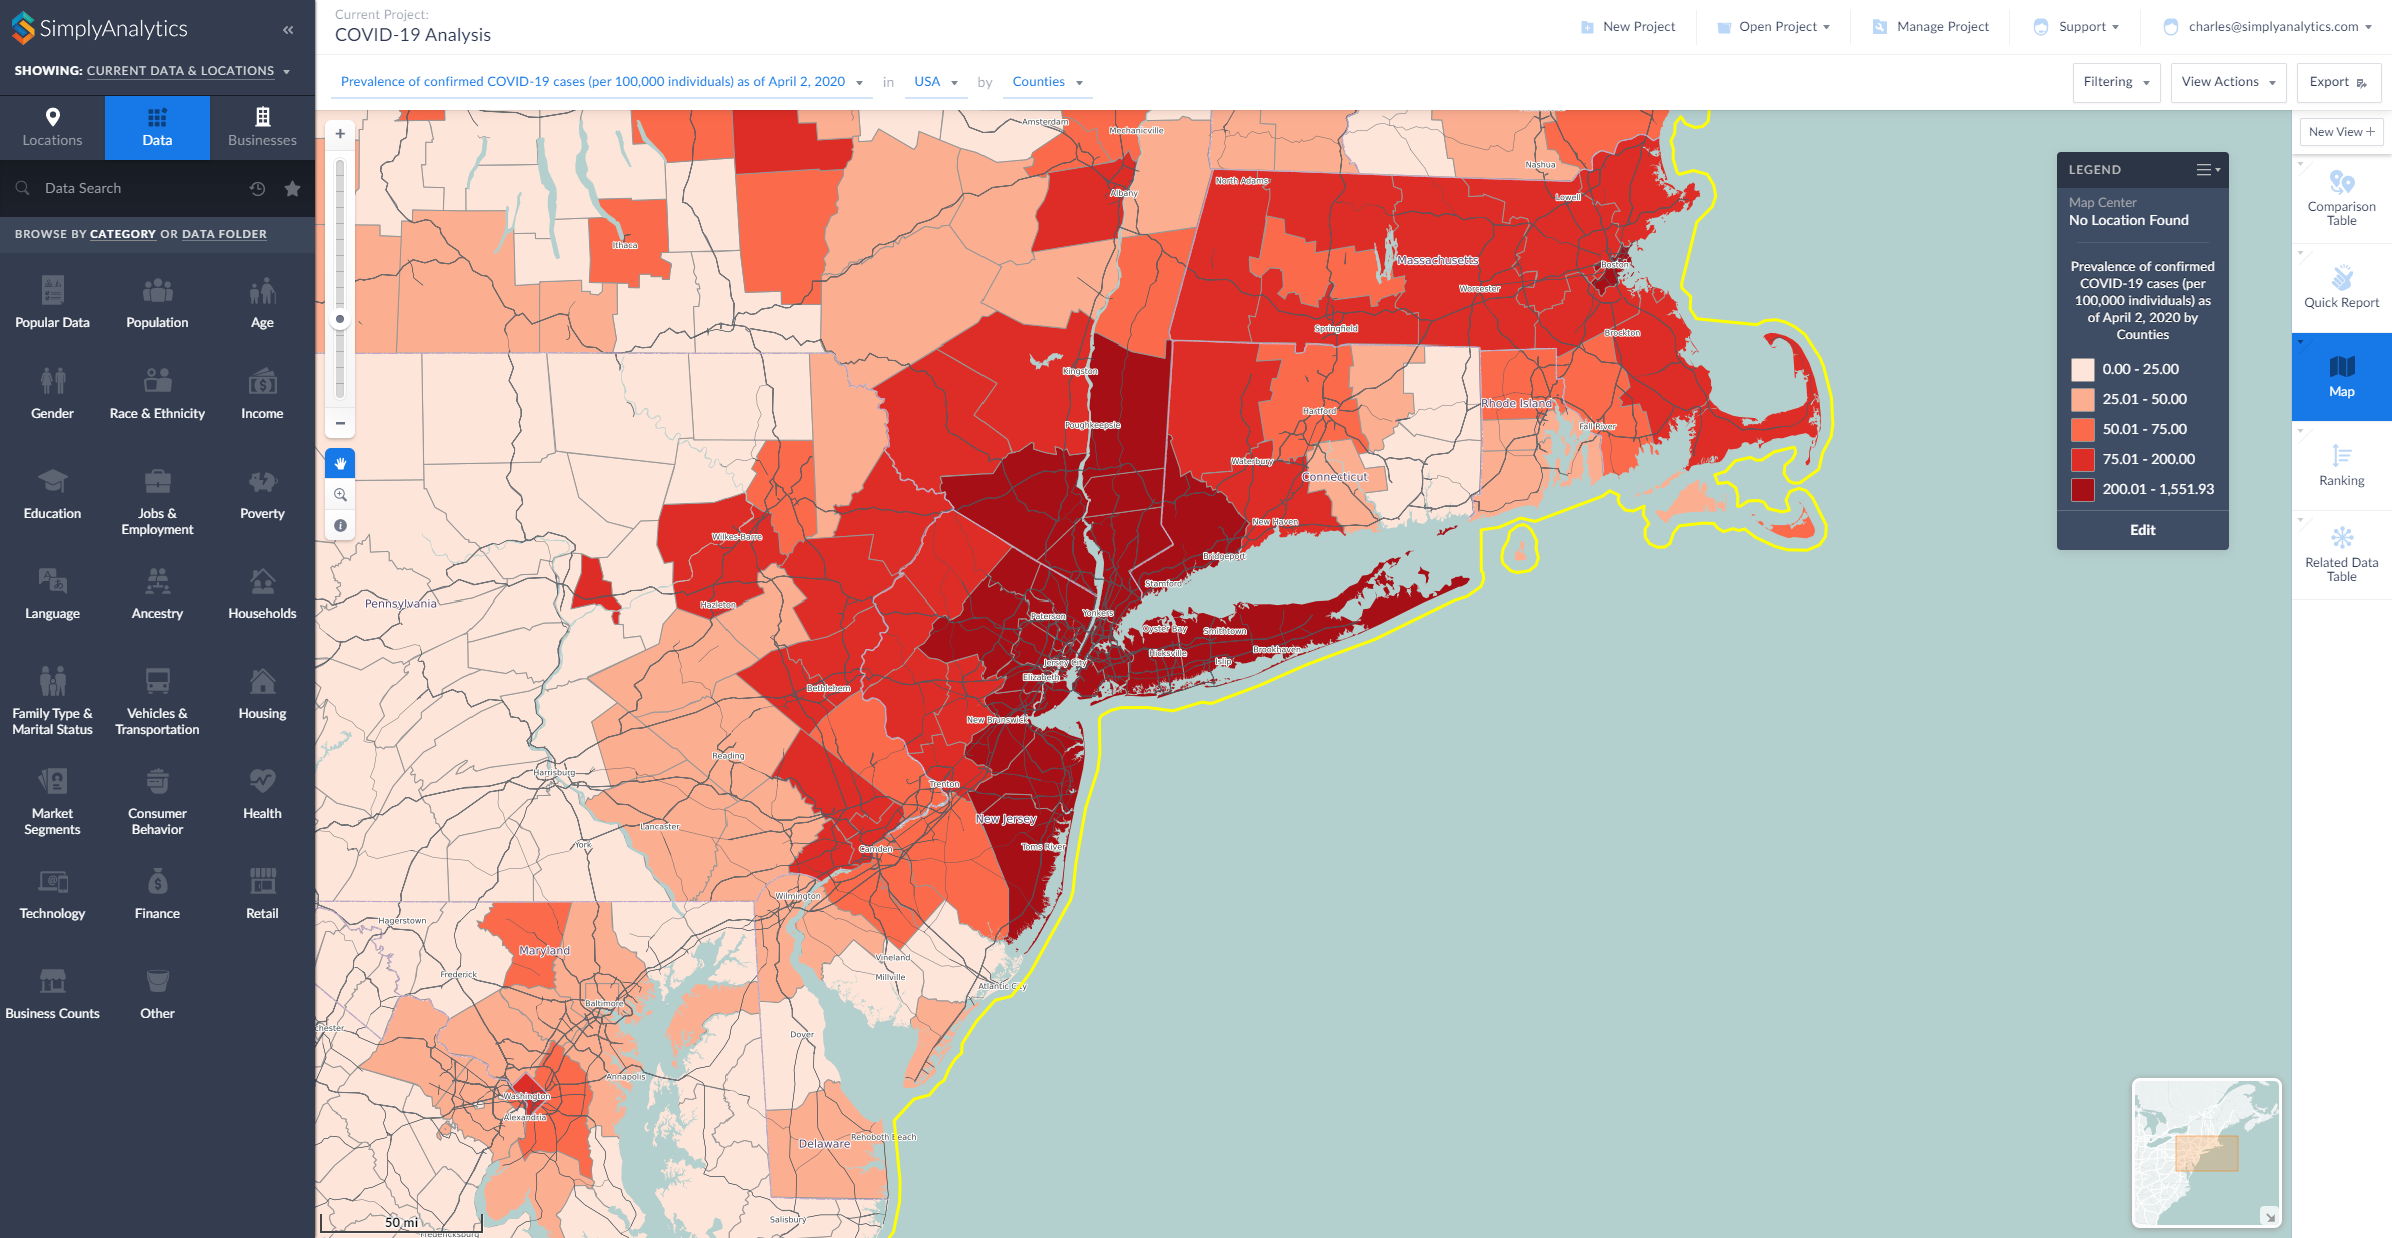
- Map View: map the COVID-19 data by County or State
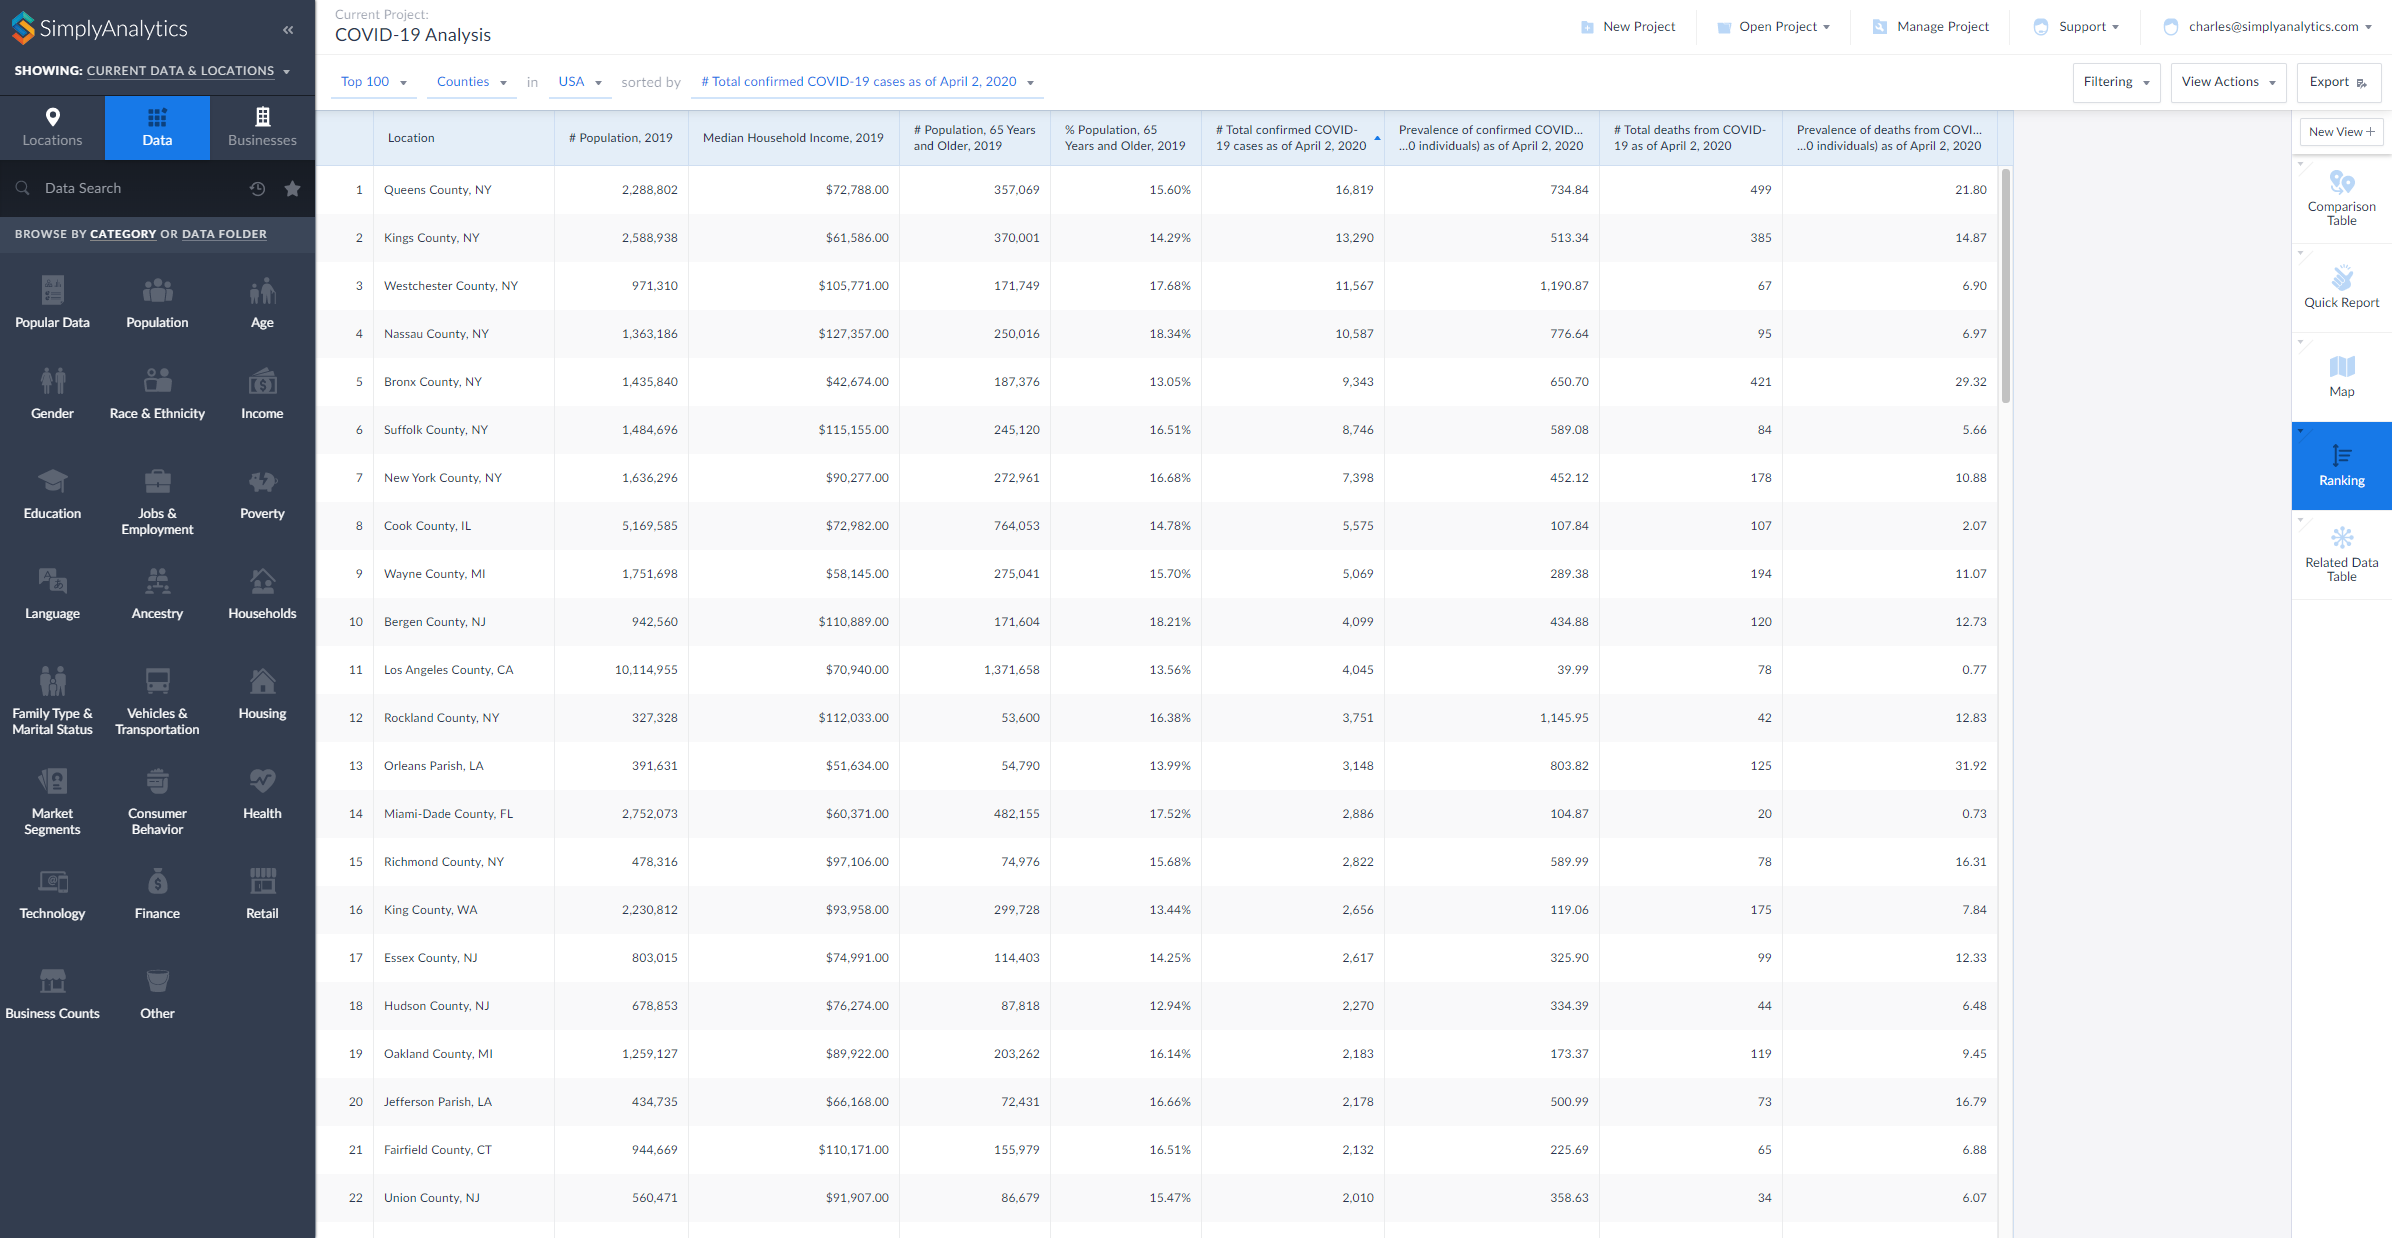
- Ranking View: rank all counties in the United States to identify areas with the highest counts or rates of COVID-19
- Comparison Table View: add your counties and states and any COVID-19 variables to this report to compare rates over time
- Related Data Table View: add one variable from a folder to this view and all of the rest will be added automatically
Here are two examples showing the data being used in SimplyAnalytics, a map and a ranking (click to enlarge):
During this difficult time we are committed to providing remote access and high quality customer support to all of our users who are now working remotely. Please contact us at support@simplyanalytics.com if you have any questions.
More from SimplyAnalytics


Posted on Feb 27, 2015 by Admin
SimplyMap is an excellent tool for market research, and it’s made even more powerful by Nielsen PRIZM data. Nielsen PRIZM is the highest quality market segment data available. Every house...
Posted on Nov 22, 2016 by Admin
We will be exhibiting at ALA Midwinter in Atlanta, Georgia in January. You can find the GRI team at Booth 1155, where we will be catching up with customers old and new, and sharing some e...
Posted on Dec 12, 2011 by Admin
Men's Health magazine has published a ranked list to help readers find the cities where Americans are the saddest and where they are living with big smiles on their faces. As they note, "...
Posted on Jul 14, 2009 by Admin
Men's Health continues to utilize SimplyMap to identify and rank U.S. cities. This time they are studying "sports-obsessed citizenry," and here is how they did it: Our stat showdown began...
Posted on Jan 12, 2020 by Admin
Happy New Year! SimplyAnalytics will be exhibiting at the ALA Midwinter meeting, held this year at the Pennsylvania Convention Center in Philadelphia on January 24th-27th. If you attend, ...
Posted on Dec 07, 2021 by Admin
Hello readers! We hope you are enjoying the holiday season as much as we are. Today, we are happy to announce a couple of improvements to SimplyAnalytics designed to help you get your res...
Posted on Mar 14, 2010 by Admin
The GRI team was honored to learn that SimplyMap was included in this year's Choice Outstanding Academic Title List, published in the January 2010 issue of Choice Magazine. This is a grea...
Posted on Nov 10, 2017 by Admin
Welcome to this week’s SimplyAnalytics blog post. Today we’re going to take a closer look at the options available to you when editing the map legend. Let’s get started! First, to start e...
Posted on Dec 03, 2015 by Admin
With the Thanksgiving holiday last week, we decided to take a quick look into SimplyMap to see what pertinent variables are available for analysis. First, open the Variables panel and cli...
Posted on Sep 10, 2010 by Admin
SimplyMap Canada is now available at several Canadian institutions, including York University and Ryerson University, in Toronto. SimplyMap Canada has all of the great features included i...