 Go up


Variable Menu Improvements & More
Posted on Dec 07, 2021 by Admin
Hello readers! We hope you are enjoying the holiday season as much as we are. Today, we are happy to announce a couple of improvements to SimplyAnalytics designed to help you get your research done more efficiently. Let’s check it out!
Variable Menu Changes
This first of two changes to the variable menus is rooted in customer suggestions that revolved around the same sort of question, namely: is there a way to quickly add in additional years or the # or % version of this variable? As of this week, the answer to this question is yes!
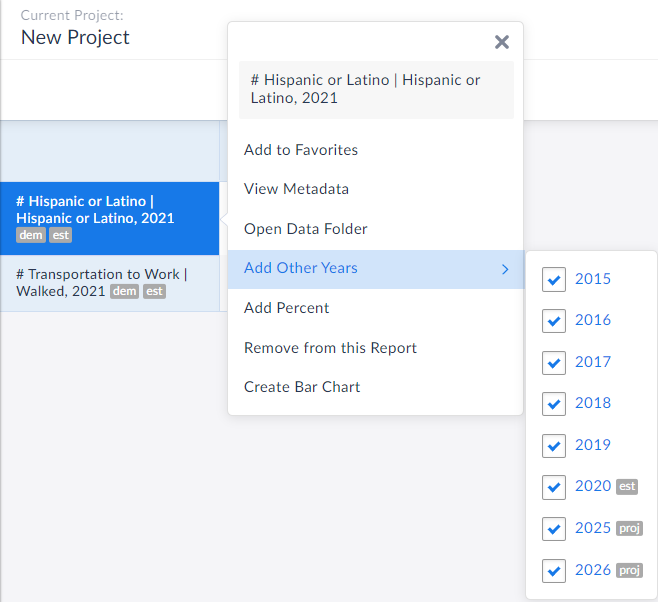
Now, when you are in a report and want to add in other years of data quickly, simply click on the variable name and refer to the Add Other Years text in the menu that displays.
In the example below, the chosen data variable is # Hispanic or Latino Population for the year 2021, but notice in the Add Other Years option, you are now welcome to instantly add in years from 2015, 2016, 2017, 2018, 2019, 2020, 2025 and 2026.
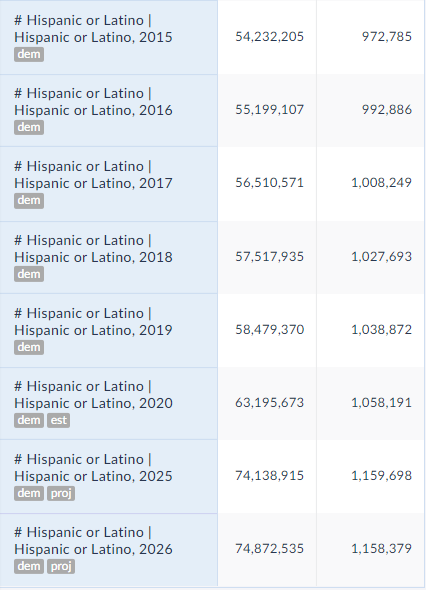
 All you need to do is select the desired year(s), close out the menu/click away and voila! The new years are automatically added to your report:
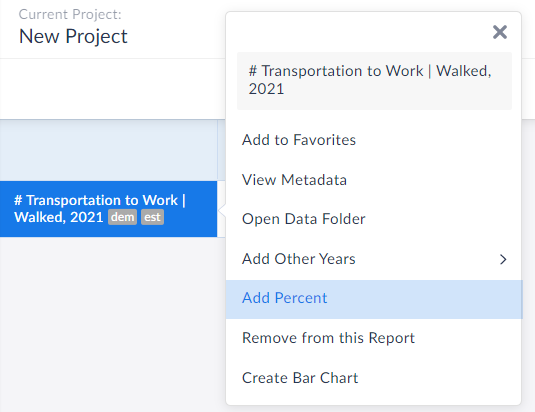
 Equally great is that users now have the ability to add in the other variation of your presently selected variable. For example, if you have # of adults walking to work in your report, you can immediately add in the % variation. This is also available from within the variable menu.
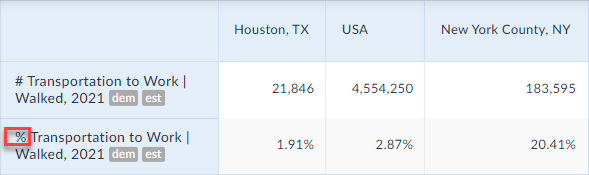
 The percent version is now added to your report:
 Create Data Table from Visualizations
We also wanted to update readers on this wonderful new feature that has flown under the radar, but is extremely useful.
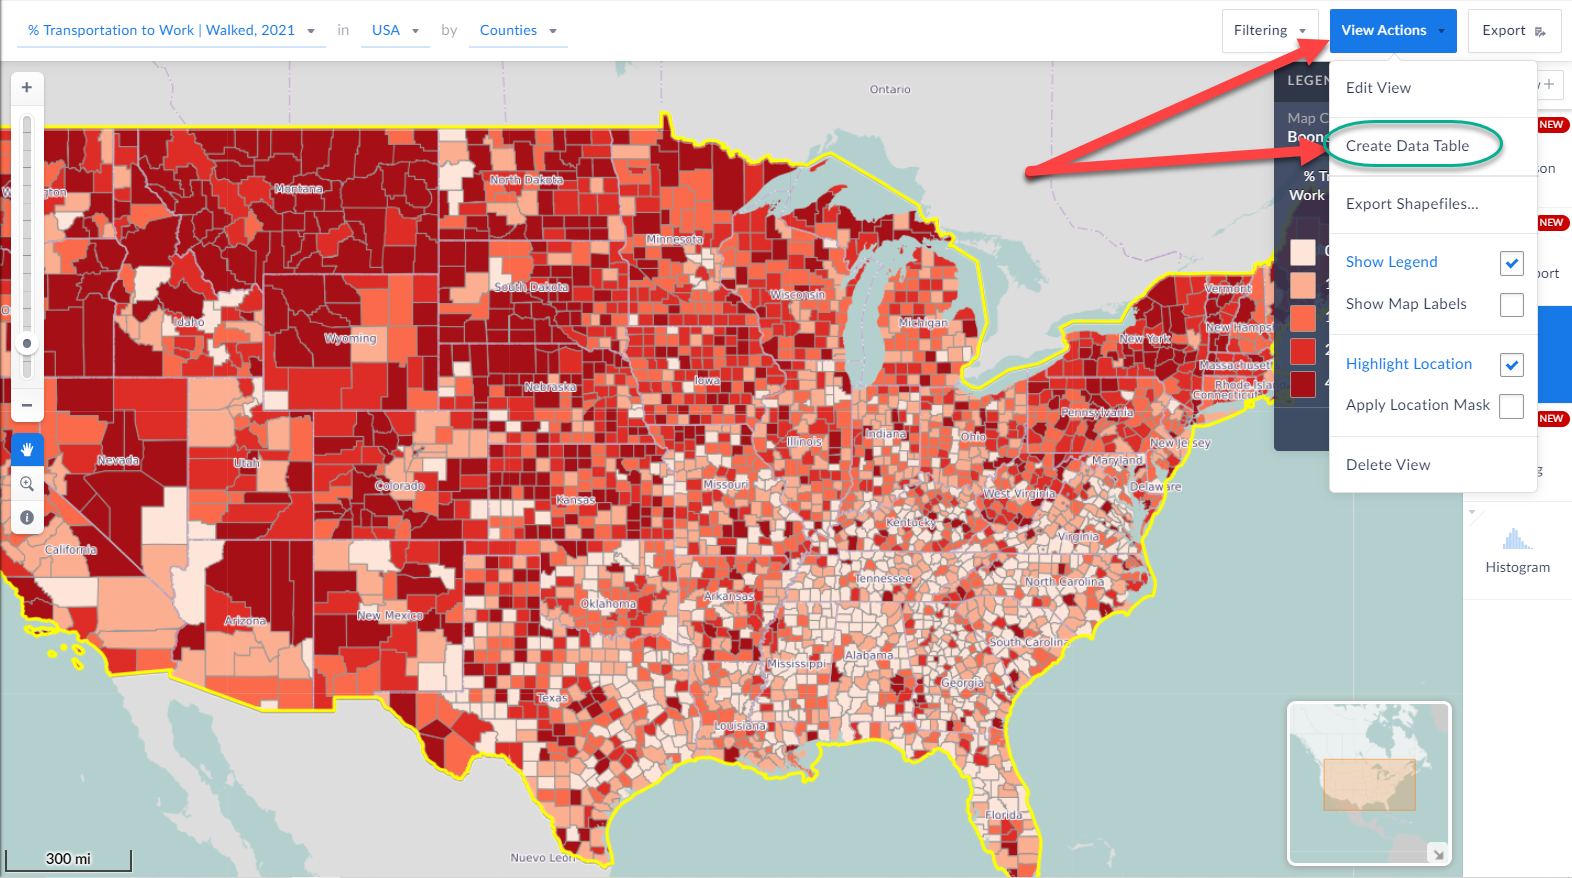
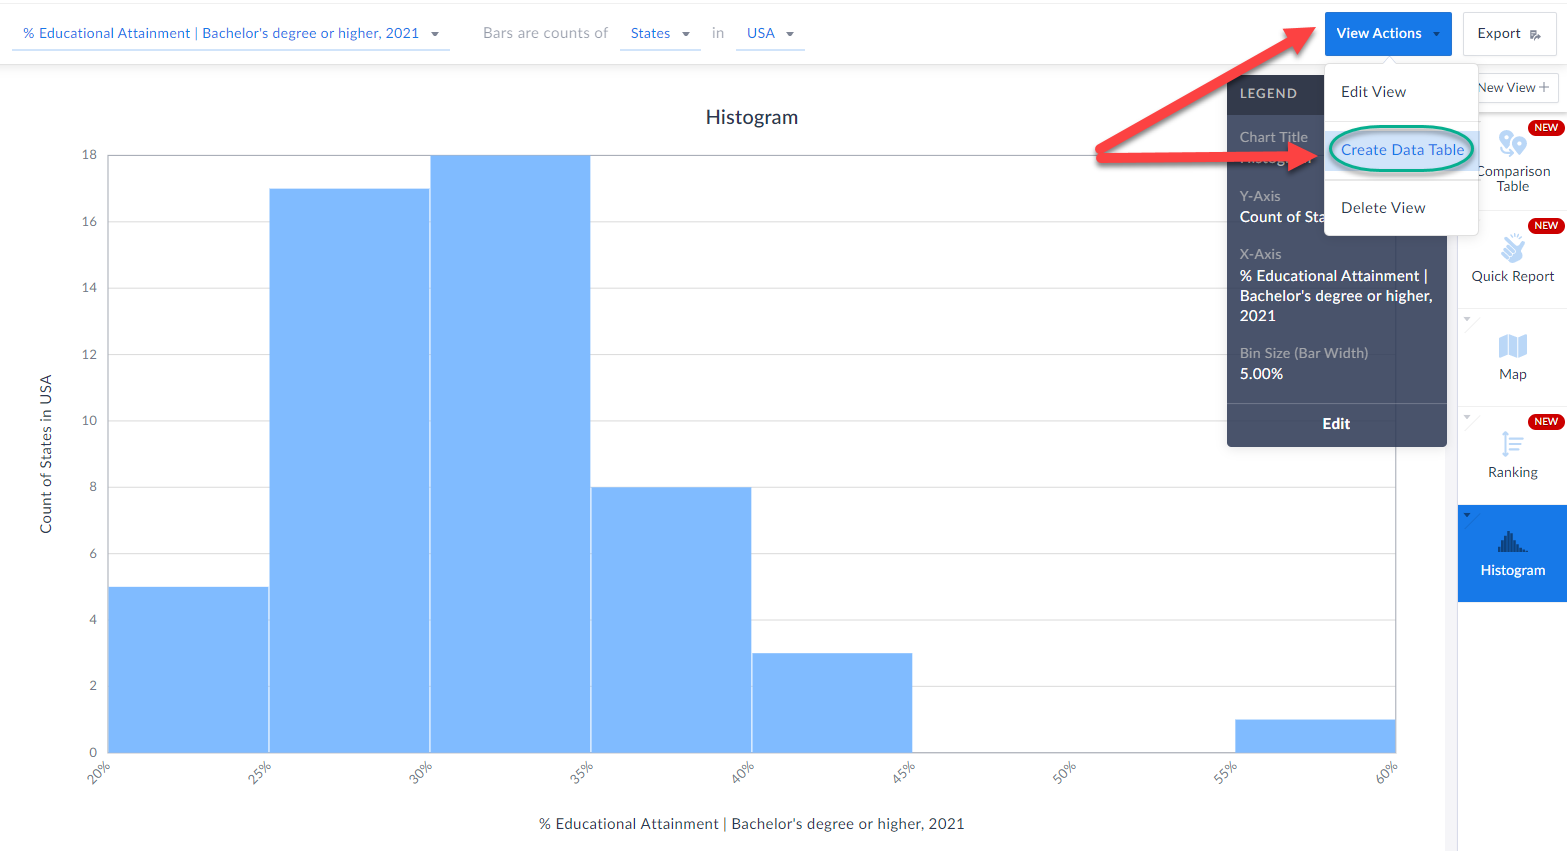
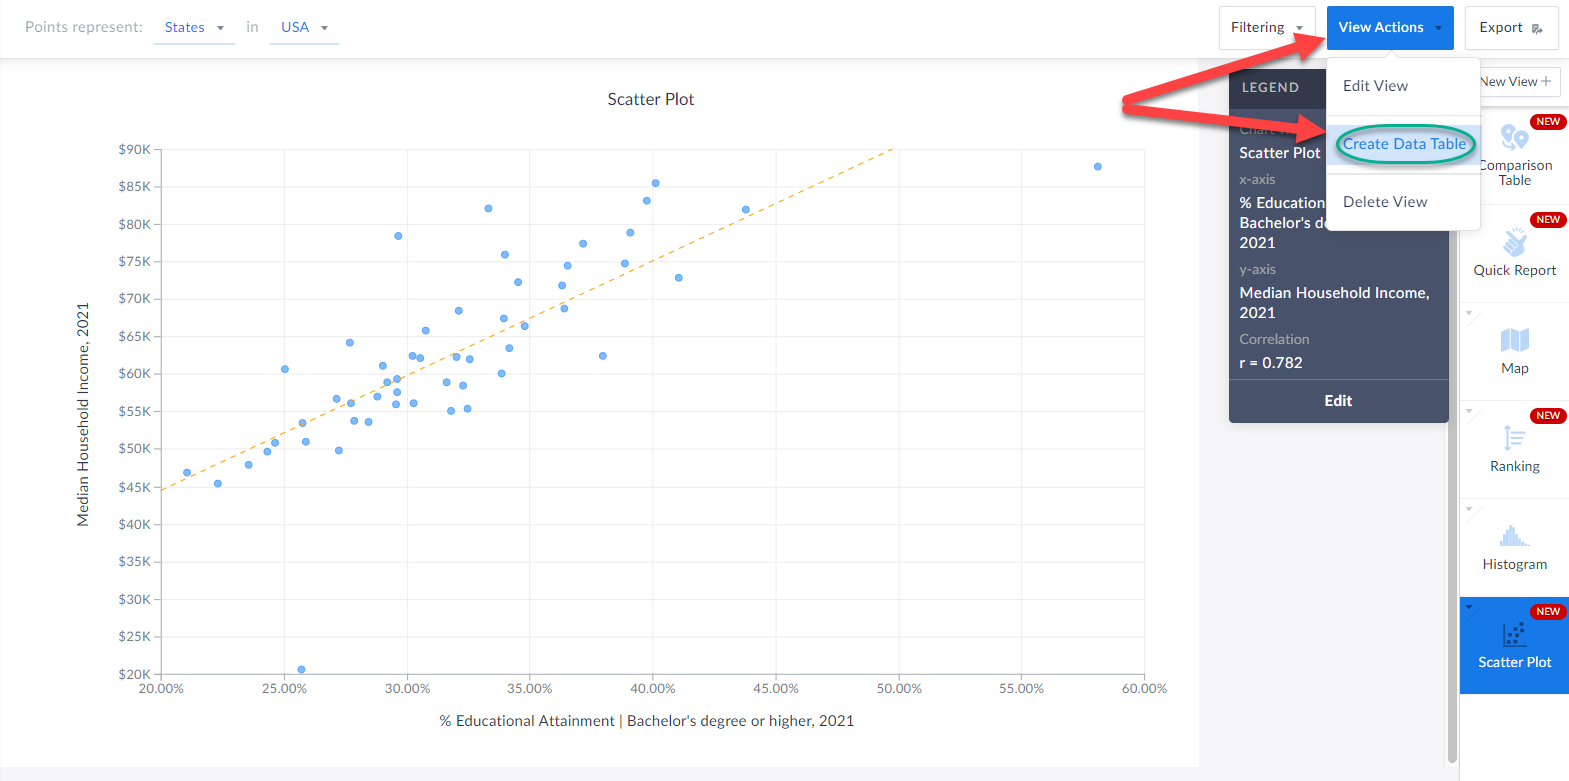
When you are in a visualization such as a map or histogram or bar chart, you are now able to instantly create a data table based on the underlying data of the visualization.
Check it out!
All you have to do is click on View Actions > Create Data Table and SimplyAnalytics will automatically generate a table for you. How cool is that?!
 We hope you enjoy these new enhancements to SimplyAnalytics - thank you as always for sending us these types of suggestions for improvements, we do listen!
Have a wonderful remainder of 2021, and as always please feel free to email us at anytime at: support@simplyanalytics.com
All you need to do is select the desired year(s), close out the menu/click away and voila! The new years are automatically added to your report:
Equally great is that users now have the ability to add in the other variation of your presently selected variable. For example, if you have # of adults walking to work in your report, you can immediately add in the % variation. This is also available from within the variable menu.
The percent version is now added to your report:
Create Data Table from Visualizations
We also wanted to update readers on this wonderful new feature that has flown under the radar, but is extremely useful.
When you are in a visualization such as a map or histogram or bar chart, you are now able to instantly create a data table based on the underlying data of the visualization.
Check it out!
All you have to do is click on View Actions > Create Data Table and SimplyAnalytics will automatically generate a table for you. How cool is that?!
We hope you enjoy these new enhancements to SimplyAnalytics - thank you as always for sending us these types of suggestions for improvements, we do listen!
Have a wonderful remainder of 2021, and as always please feel free to email us at anytime at: support@simplyanalytics.com
More from SimplyAnalytics


Posted on May 17, 2012 by Admin
We will be exhibiting at the American Library Association (ALA) Conference in Anaheim Friday June 22nd - Monday June 25th. Visit us at Booth 421 to learn more about SimplyMap and enter ou...
Posted on May 25, 2010 by Admin
We will be exhibiting at the 2010 SLA Annual Conference & INFO-EXPO June 13-15 at the Ernest N. Morial Convention Center in New Orleans, LA. Join us at booth 1537 - bring your quest...
Posted on Apr 14, 2016 by Admin
This week’s SimplyMap report will provide an overview of one of the more advanced functionalities in SimplyMap - applying multiple filter conditions. Filters can be applied to any map or ...
Posted on Jan 23, 2024 by Admin
We are excited to again make the trip to Los Angeles for SCELCapalooza 2024 hosted at Loyola Marymount University! Please drop by our table on Wednesday, Feb. 28th to learn more about Sim...
Posted on Sep 05, 2019 by Admin
We are pleased to be exhibiting again at the Charleston Library Conference, on Tuesday November 5th, 2019. The Vendor Showcase will be held in the Gaillard Center Grand Ballroom (95 Calho...
Posted on Dec 11, 2023 by Admin
Hello readers! We have some fantastic news to share. SimplyAnalytics is thrilled to announce the addition of 2020 Election data to our expanding collection of powerful datasets. With this...
Posted on Mar 21, 2011 by Admin
Men's Health magazine decided to crown one town America's Most Socially Networked City, and has generated quite a buzz in the process. Their survey examined the number of Facebook and Li...
Posted on Mar 09, 2010 by Admin
The GRI team will be exhibiting at the 2010 Public Library Association conference later this month at the Oregon Convention Center in Portland, OR. The PLA National Conference is the prem...
Posted on Jun 09, 2021 by Admin
Hello (virtual) ALA attendees! Thank you for dropping by our booth to learn more about SimplyAnalytics. Please email us if you have any questions or would like a live demo or free 30 day ...
Posted on Apr 17, 2009 by Admin
The Special Libraries Association will hold its Annual Conference in Washington, DC at the Washington Walter E. Washington Convention Center from June 14-17 2009. The conference will crea...